Overlapping Diagram and Target Market Location – Visualizing Marketing Strategy
RJ0600082_27
- Last Update 07/12/2025
- File Size 1.9MB
- # of Slides 2
- File Format PPTX
- Slide Ratio 16:9
- Color
Keywords
- #Content-Based Slides
- #Design-Based Slides
- #Marketing Plan and Strategy
- #Diagram
- #Other
- #Target Market Strategy
- #Distribution Strategy
- #Cluster
- #Combination Diagram
- #16:9
- #overlapping diagram PowerPoint
- #Venn diagram slide template
- #market location map presentation
- #target market analysis PPT
- #marketing strategy visualization slide
About the Product
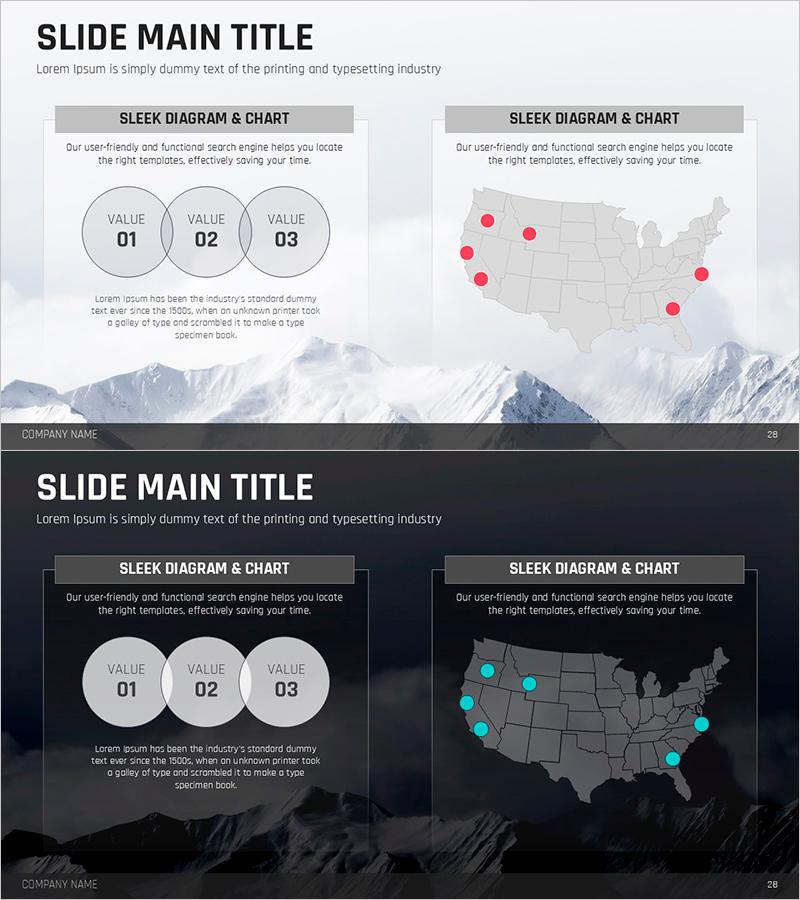
A professional overlapping diagram PowerPoint slide designed to visualize marketing strategy and target market analysis. Features a 3-way Venn diagram showing market segmentation and customer intersection, paired with a US map marked by red data points indicating regional target locations. Includes two design versions—light background and dark background—allowing flexible presentation environment adaptation. Ideal for marketing strategy presentations, business development pitches, market entry planning, and competitive analysis reports. Fully editable slide template ready for immediate use in professional business presentations.
Usage Points
-
Main Usage
Simultaneously express target market regional distribution and customer segment intersection during marketing strategy development. The 3-way Venn diagram overlapping areas clarify market segmentation logic, while map data points emphasize actual market entry regions, supporting data-driven strategic decision-making.
-
How to Use
Deploy in the market analysis section early in presentations to explain target customer characteristics and geographic distribution. Input market segment names into Venn diagram areas and modify map point locations to reflect actual expansion regions, creating customized strategic materials.
-
Recommended For
Marketing managers, business planning teams, and sales strategists explaining target market analysis results to executives and investors. Particularly effective for new market entry strategies, regional marketing campaign planning, and customer segment analysis presentations.
-
Slide Structure
Slide 1: Light background with 3 overlapping circles forming Venn diagram (labeled VALUE 01, 02, 03) and US map on the right with red data points. Slide 2: Dark background version with identical layout using cyan points for high-contrast effect. Both slides feature 2-column layout positioning diagram and map side-by-side for balanced visual composition.
Related Products
-

PowerPoint Slide for Asian Market Analysis
#Marketing Plan and Strategy #Diagram #Other
-

Orange Purple Green Map for Market Strategy Visualization
#Marketing Plan and Strategy #Other #Target Market Strategy
-

Structure Presentation Template for the United States – Marketing and Distribution Strategy
#Marketing Plan and Strategy #Other #Target Market Strategy
-

Korean Export Beer Products – Marketing Strategy Map Infographic
#Marketing Plan and Strategy #Diagram #Other
