
Market and Competitor Analysis
Visualize Coffee Sales Status with Donut Chart – Market Analysis
RJ0900016_22
- Last Update 12/21/2025
- File Size 0MB
- # of Slides 2
- File Format PPTX
- Slide Ratio 16:9
- Color
Keywords
About the Product
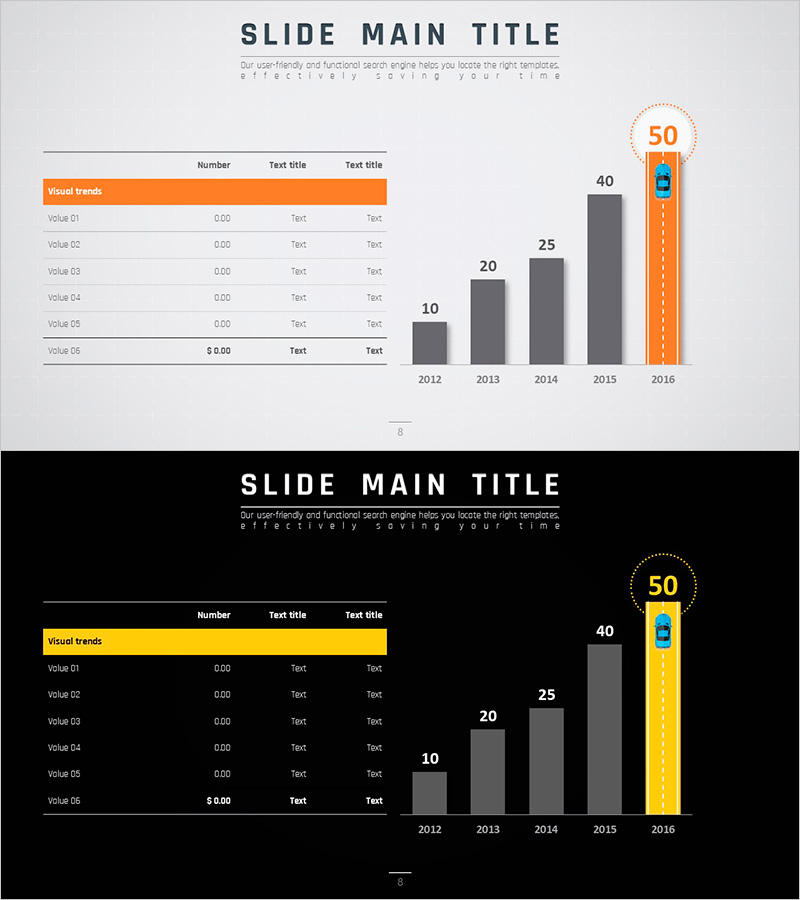
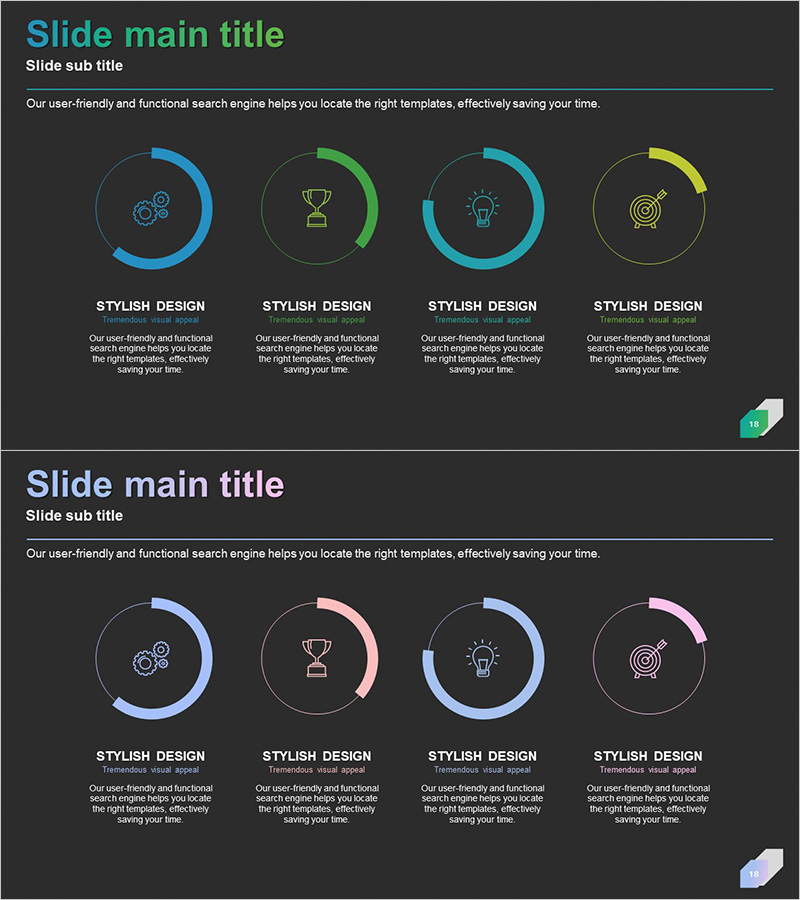
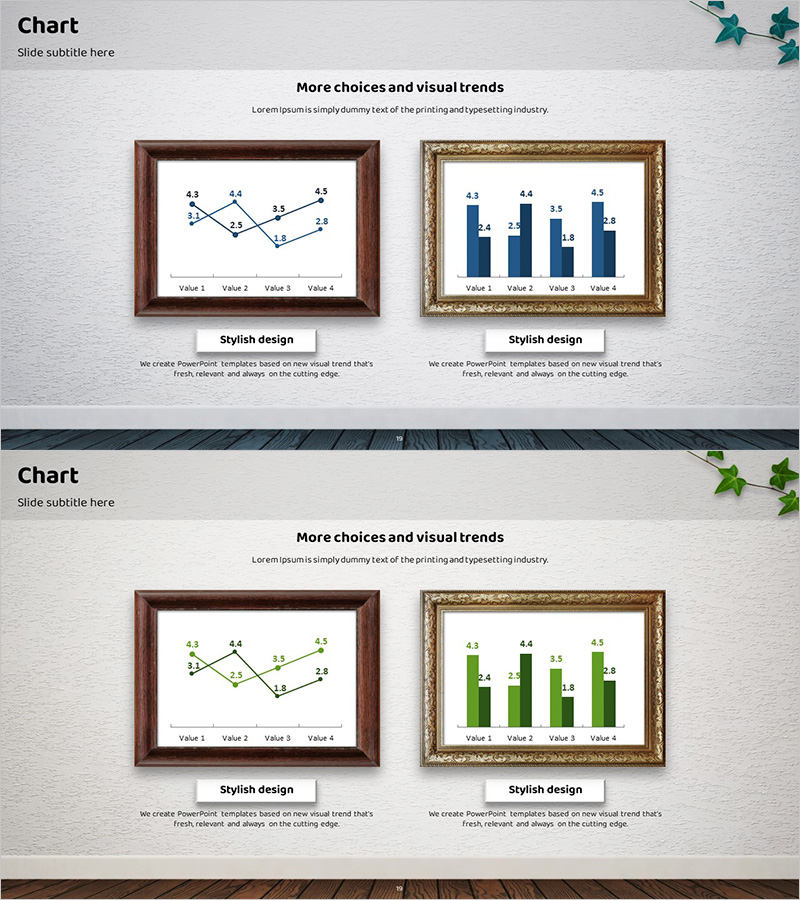
This slide utilizes a donut chart to visually emphasize the coffee sales status. The elements include a central revenue percentage and a unique design surrounding the chart, harmonizing the main color brown with the accent colors red and blue. This template is particularly useful in market and competitor analysis materials or financial planning presentations, making it easy to visualize data insights. Text and data fields are easy to replace, with an overall editing difficulty rated as 'easy', allowing for quick integration into various presentation formats.
Related Products
-
Visualizing Business Strategies with Tables & Charts – Clear Data Presentation
#Business Promotion Strategy #Financial Plans and Performance #Diagram
-
Business Development Status Diagram – Market Share and Competitive Analysis
#Product/Service #Market and Competitor Analysis #Diagram
-
Eco-friendly Business Project Goal Market Strategy – Visualizing the Market Analysis
#Market and Competitor Analysis #Graph #Competitor Analysis
-

European Market Coverage & Share – Pie Chart for Market Analysis
#Market and Competitor Analysis #Marketing Plan and Strategy #Graph
