Company Introduction
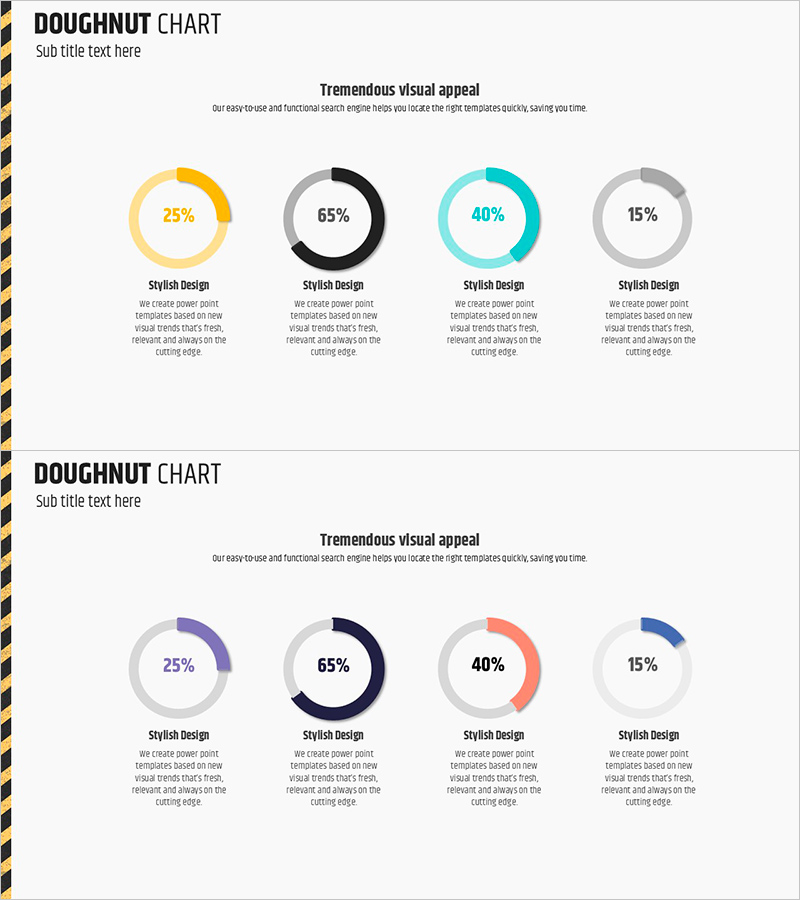
Safety Template Donut Chart – Visualizing Performance and Management
RJ0900011_21
- Last Update 12/21/2025
- File Size 0.2MB
- # of Slides 2
- File Format PPTX
- Slide Ratio 16:9
- Color
Keywords
About the Product
This slide utilizes a donut chart to highlight market share and key performance metrics visually. The colors yellow, turquoise, and purple create an engaging and clear presentation of information. The layout distinctly separates the top title area from the data visualization section, aiding comprehension and searchability. Ideal for corporate performance analysis and market analysis, it emphasizes 'safety' to enhance business credibility. Text and data fields are easily replaceable, rated as 'easy' in editing difficulty, allowing swift adaptation to various presentations.
Related Products
-
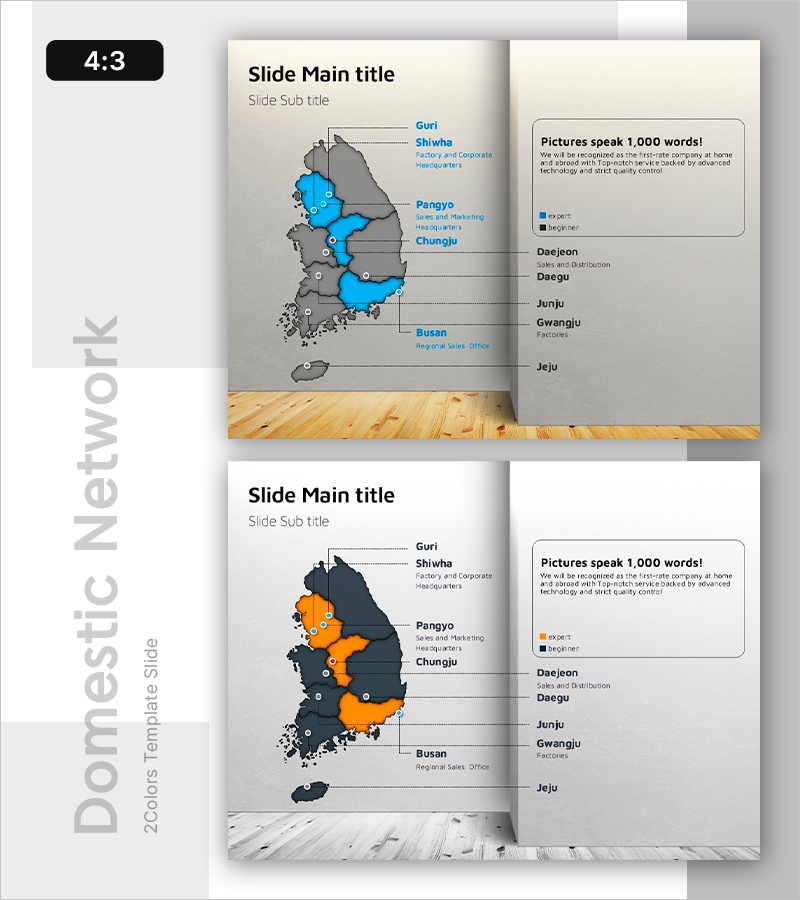
Key Regional Hubs Visualization – Showcasing Enhanced Connectivity
#Company Introduction #Market and Competitor Analysis #Diagram
-
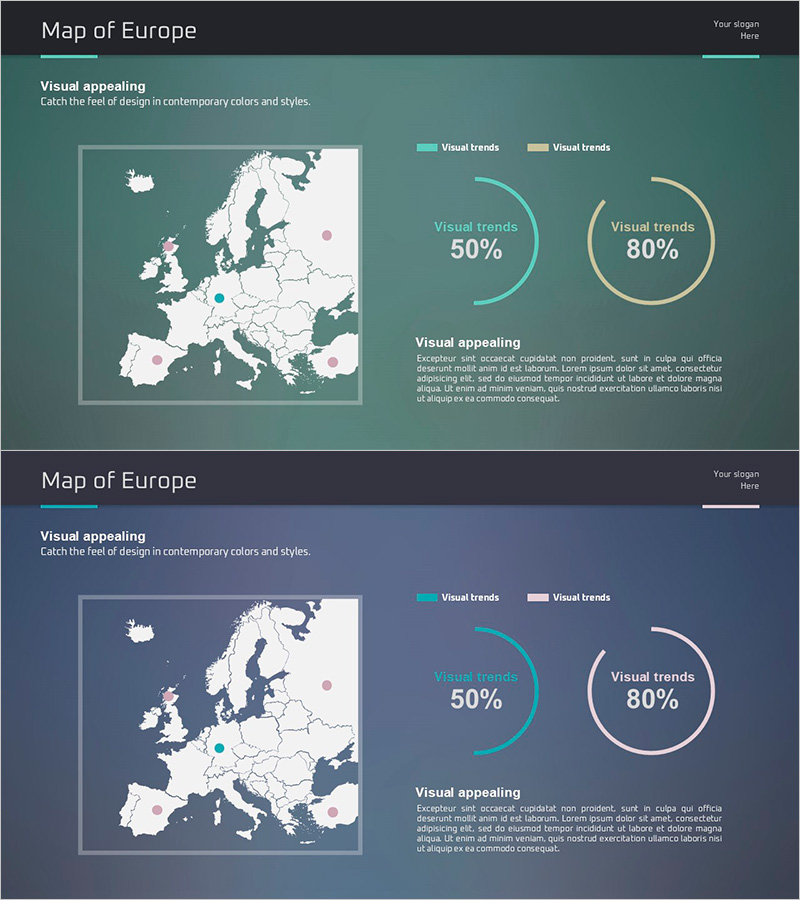
Idea Presentation Template Wide – Market Analysis and Visualization
#Market and Competitor Analysis #Graph #Other
-
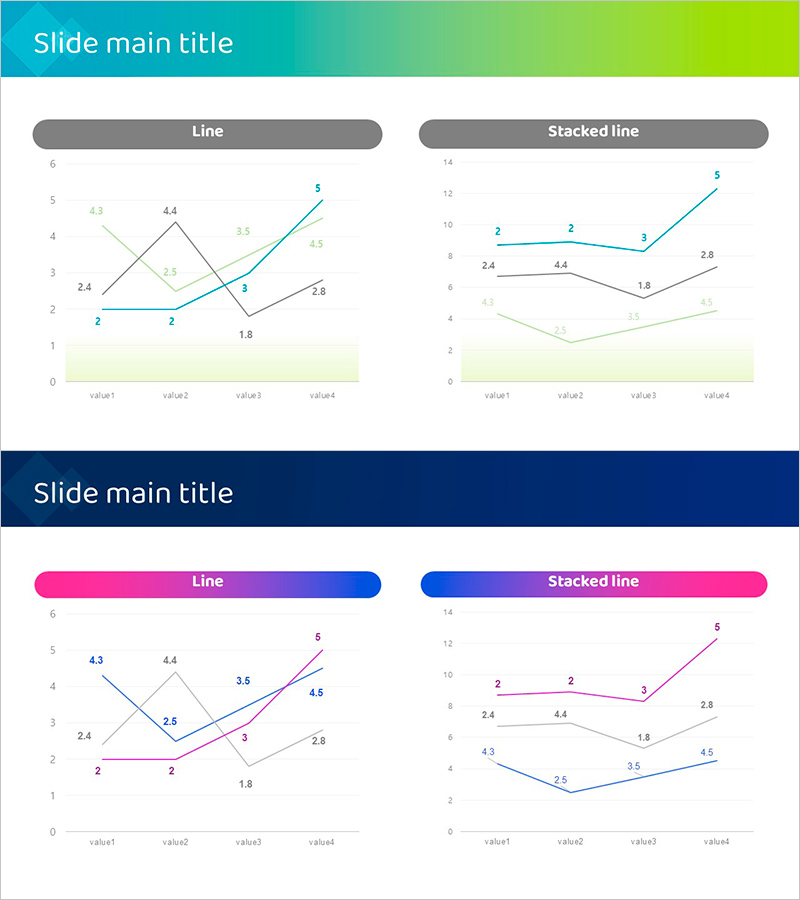
Blue Purple Line Chart Page – Visualizing Data Trends
#Graph
-
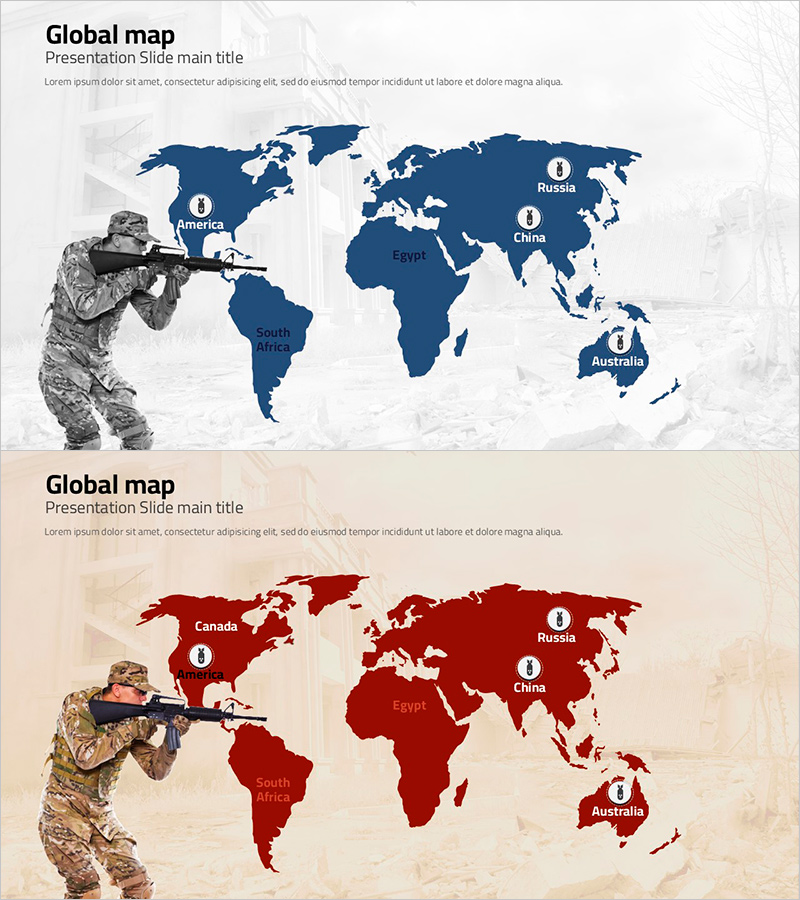
War Global Map – Market Analysis and Strategy
#Market and Competitor Analysis #Marketing Plan and Strategy #Other
