Market and Competitor Analysis
Comparative Graph of Architecture – Visualizing Competitive Advantage
RJ0900009_25
- Last Update 12/21/2025
- File Size 0.1MB
- # of Slides 2
- File Format PPTX
- Slide Ratio 16:9
- Color
Keywords
About the Product
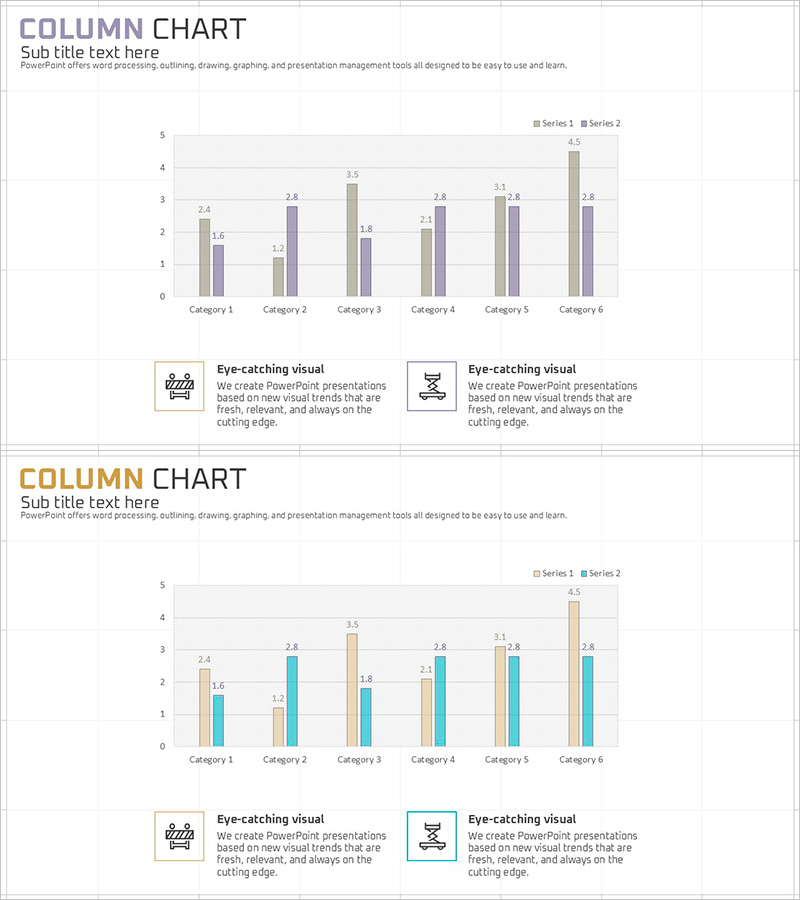
This slide showcases various comparative data within the architecture field using horizontal and vertical bar graphs to highlight competitive advantages. Its clean design intuitively conveys performance metrics across categories, making it ideal for market and competitive analysis. The harmonious color combination of purple, teal, and orange enhances the readability of information while providing valuable insights for goal achievement. This slide delivers a strong visual impact when applied in architecture project reports or presentations.
Related Products
-
Demand Charts in Region – A Convincing Tool for Market Analysis
#Market and Competitor Analysis #Graph #Other
-
Enhancing Marketing Strategy with Radar Graph Comparison Chart
#Marketing Plan and Strategy #Graph #Promotion Strategy
-

Dot Patterns Wide PowerPoint Template Silhouette – Customer Success Case Analysis
#Market and Competitor Analysis #Customer Success Stories #Other
-
Technology Status Pentagon Area Diagram
#Product/Service #Business Introduction #Graph
