Market and Competitor Analysis
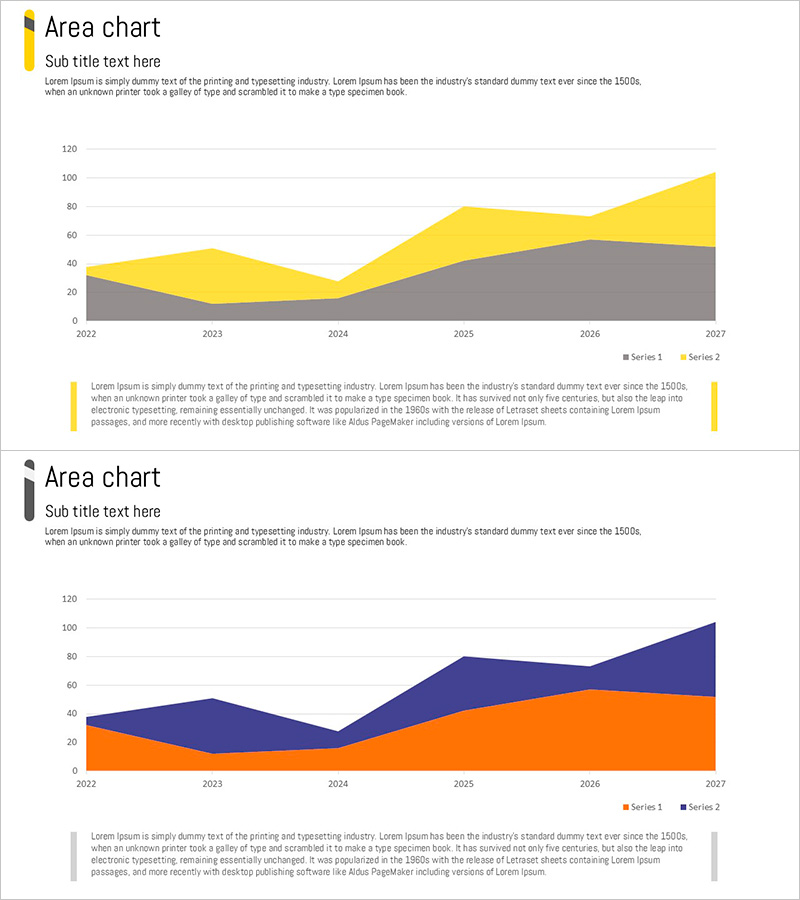
Yellow Orange Area Chart – Visualization for Market Analysis
RJ0900007_16
- Last Update 12/21/2025
- File Size 0.1MB
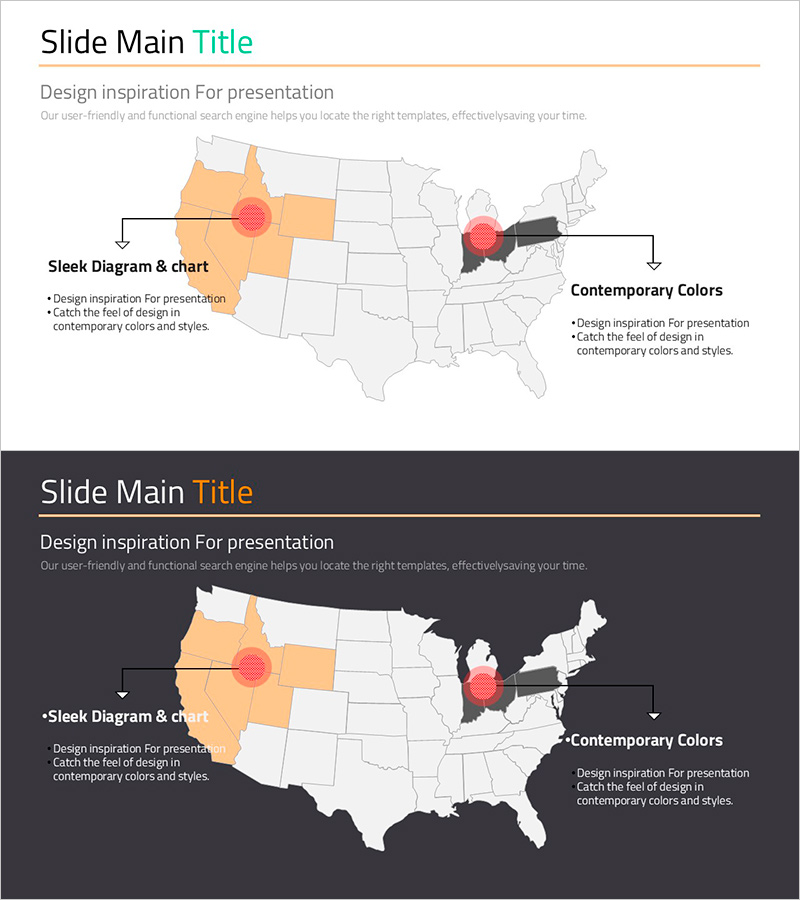
- # of Slides 2
- File Format PPTX
- Slide Ratio 16:9
- Color
Keywords
About the Product
This slide features an area chart composed of yellow and orange shades to visually represent market analysis data. The design is modern and sleek, effectively conveying information clearly and effortlessly. The color combination enhances clarity and aids in easily interpreting the given data. Optimized for highlighting yearly data changes, it's suitable for various business scenarios such as management meetings, reports, and investment presentations. Editing this slide is rated easy, allowing for straightforward replacement of text and graphs for immediate use.
Related Products
-
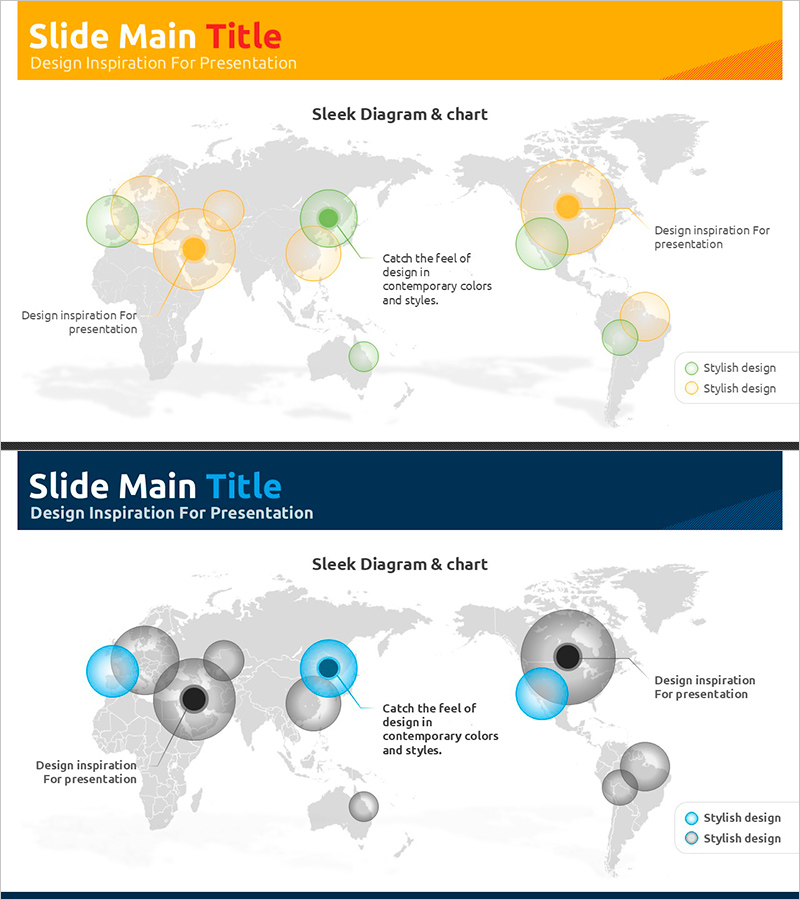
World Map Distribution Chart – Global Market Analysis Tool
#Company Introduction #Market and Competitor Analysis #Other
-
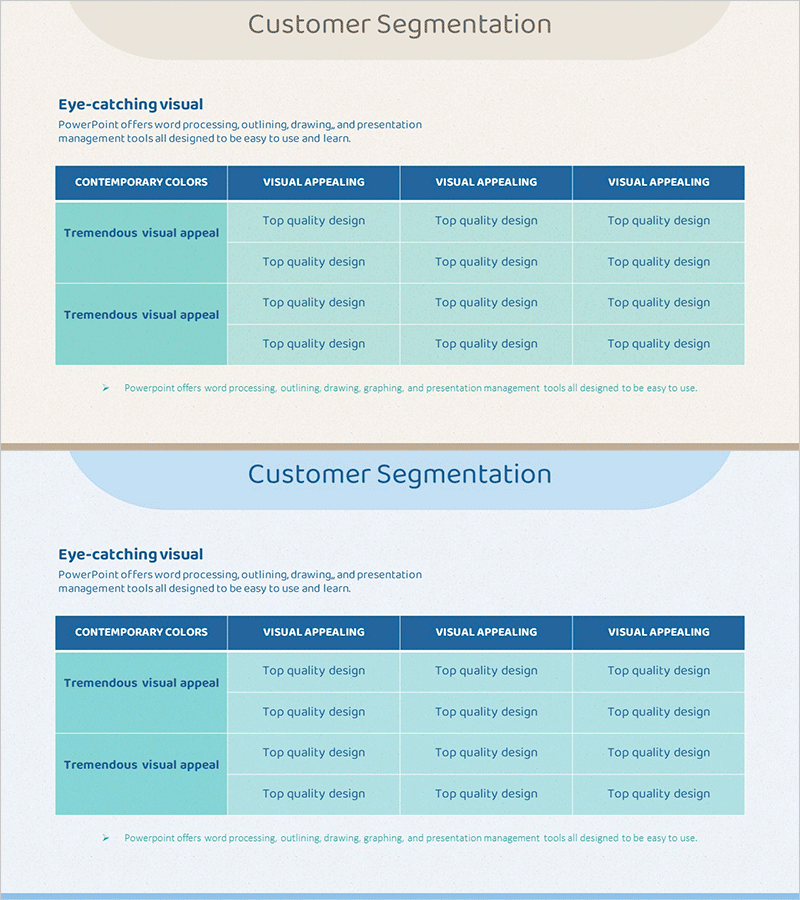
Consumer Response Analysis and Improvement Summary Table
#Company Introduction #Market and Competitor Analysis #Diagram
-
Alimony Ranking Graph – Visualizing Financial Performance
#Financial Plans and Performance #Graph #Other
-
Target Market Analysis - Market Trends and Strategy
#Market and Competitor Analysis #Marketing Plan and Strategy #Other
