Company Introduction
Visualization of Traditional Items Proportion – Market Share Analysis
RJ0800050_23
- Last Update 12/21/2025
- File Size 0.3MB
- # of Slides 2
- File Format PPTX
- Slide Ratio 16:9
- Color
Keywords
About the Product
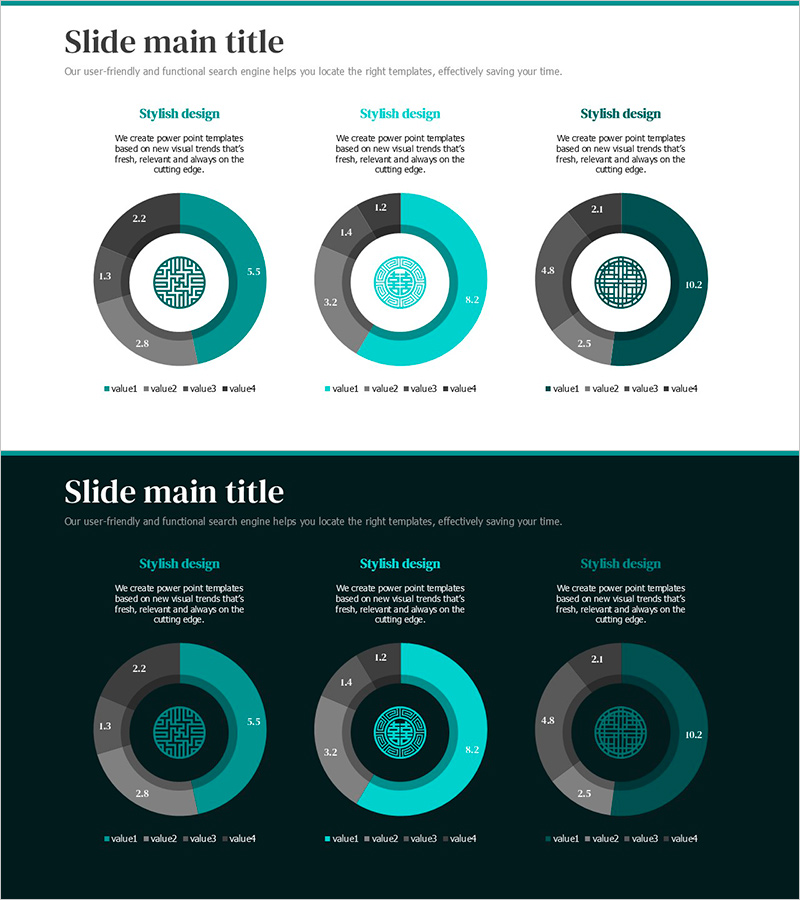
This slide features a doughnut chart designed to visually represent the proportion of traditional items. With a harmonious blend of turquoise and green tones, it exudes a sense of stability and sophistication, allowing for clear comparisons of each item's proportion. This slide is ideal for market share analysis or presentations on key achievements. Text and data can be easily replaced, with an editing difficulty rated as 'easy', making it perfect for immediate practical use in presentations.
Related Products
-
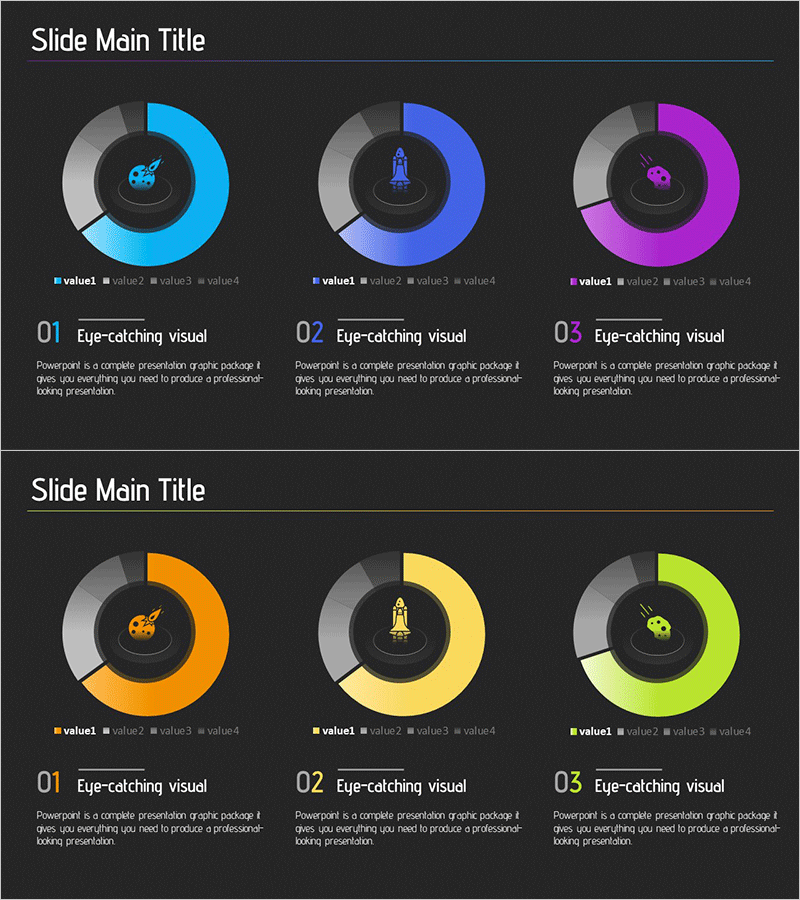
Space Industry Technology Status Graph – The Start of Innovation
#Product/Service #Market and Competitor Analysis #Graph
-

Awards Certificate Summary Slides – Visualizing Achievements
#Company Introduction #Diagram #Awards and Certifications, and Patents
-
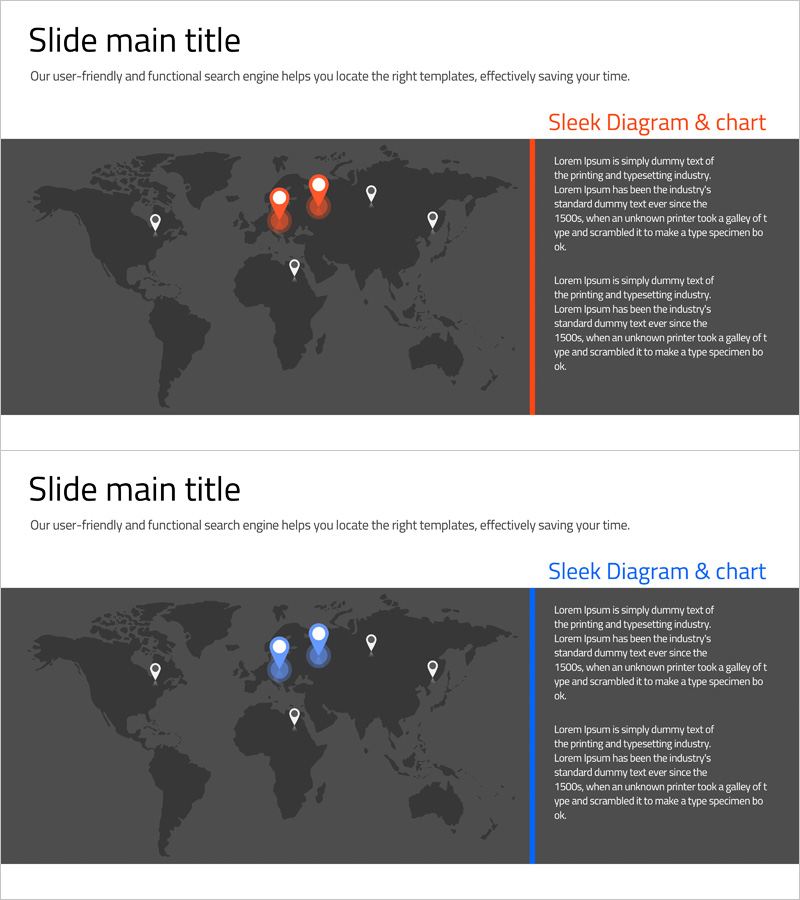
Global Network Target Market Strategy – Insights for Global Business Expansion
#Company Introduction #Market and Competitor Analysis #Other
-
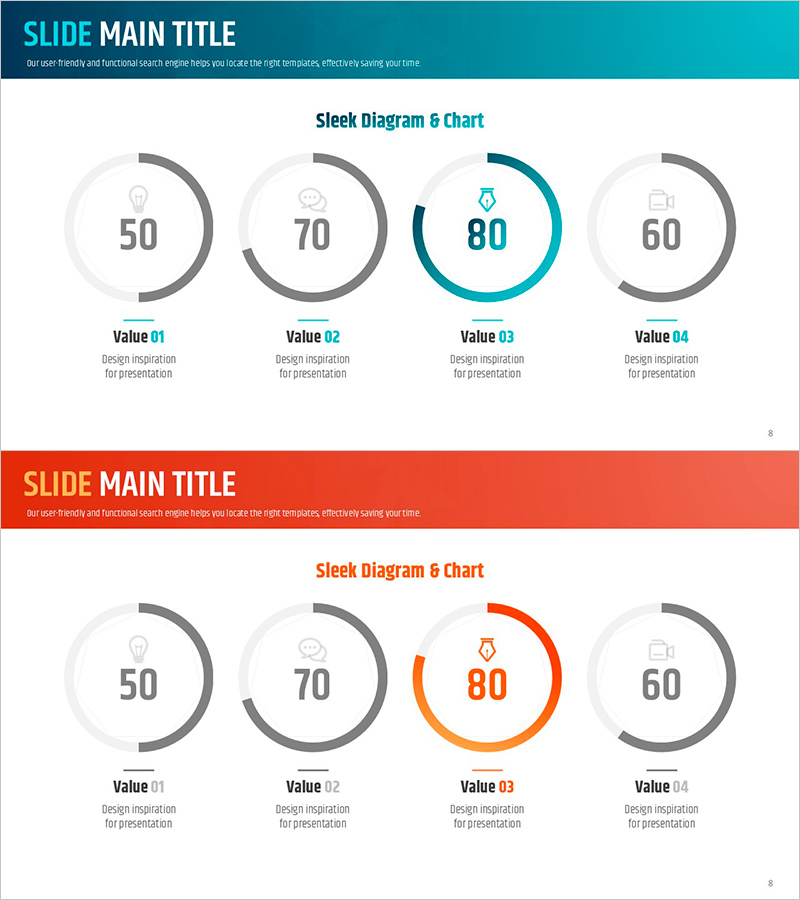
Ability Donut Chart for Performance Visualization – Emphasizing Key Achievements
#Company Introduction #Product/Service #Graph
