
Market and Competitor Analysis
Visualizing Distribution Business Sales Composition with Donut Chart
RJ0800046_28
- Last Update 12/21/2025
- File Size 0.8MB
- # of Slides 2
- File Format PPTX
- Slide Ratio 16:9
- Color
Keywords
About the Product
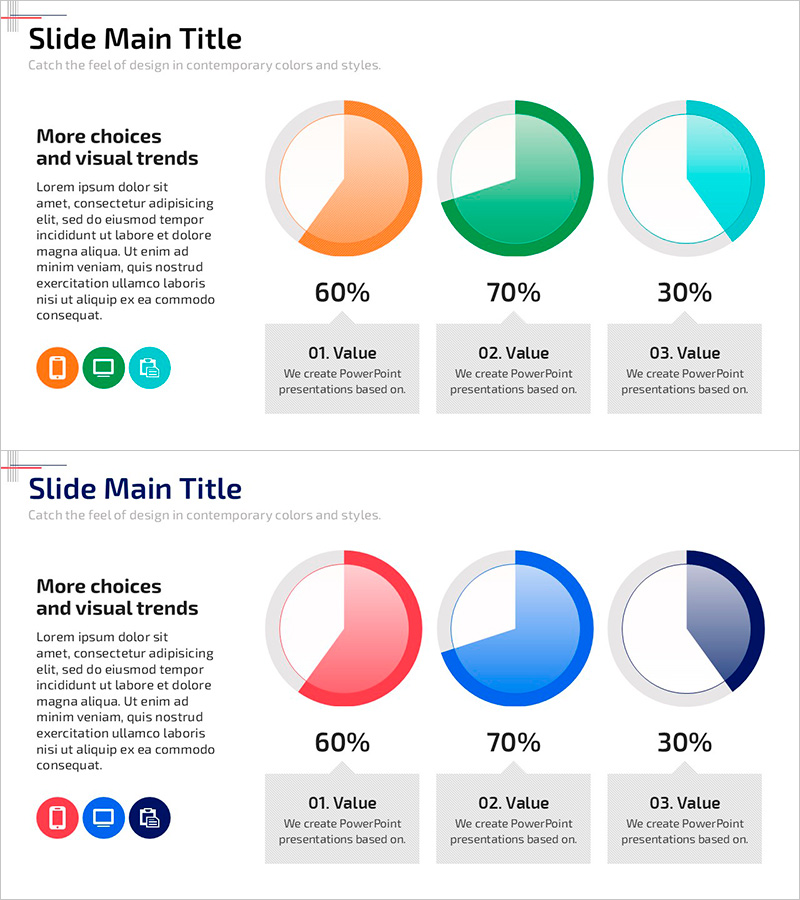
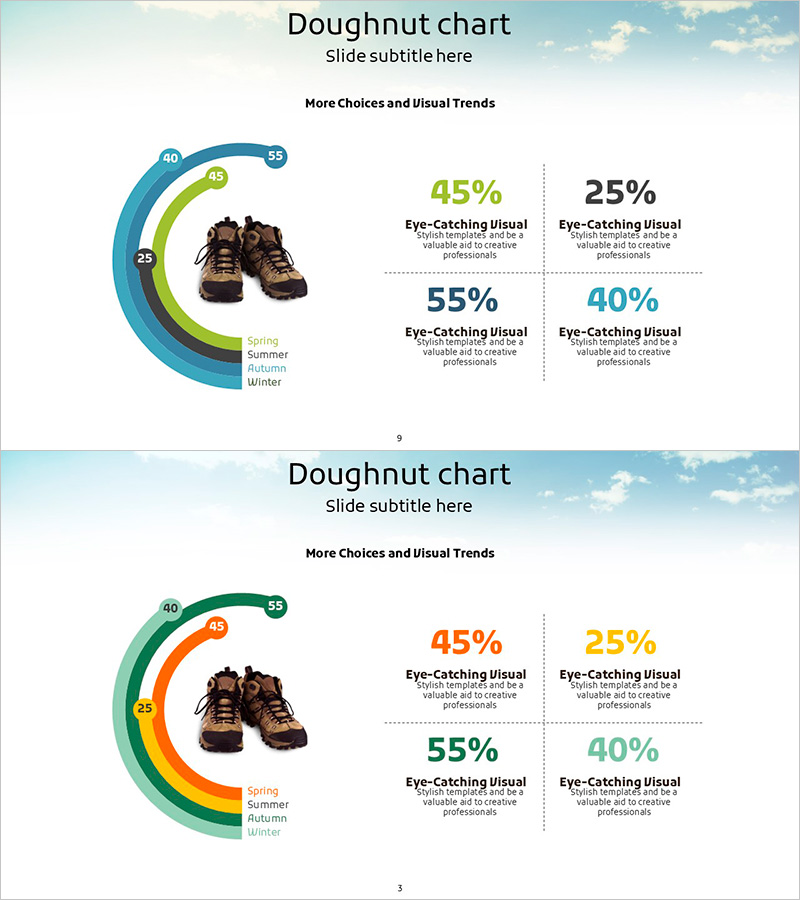
This slide features a donut chart designed to visually emphasize the sales composition of the distribution business. The main colors red and yellow are utilized for clear data presentation, structured with a title area at the top, the graph in the middle, and a description section at the bottom. Ideal for discussions on market share and competitive analysis, this slide conveys a message of 'growth' to support impactful presentations. The text and data fields are easily editable, classified as 'easy' for editing, allowing quick updates for various presentation needs.
Related Products
-

Blue Green Donut Pie Chart – Ideal for Market Analysis
#Market and Competitor Analysis #Graph #Market Analysis
-
Three Key Performance Pie Charts – Visualization of Performance Analysis
#Company Introduction #Market and Competitor Analysis #Graph
-
Mountain Climbing Market Share and Customer Analysis Donut Chart
#Market and Competitor Analysis #Market Share #Competitive Advantage
-
Business Direction Radial Chart – Market and Competitive Analysis
#Product/Service #Market and Competitor Analysis #Graph
