
Product/Service
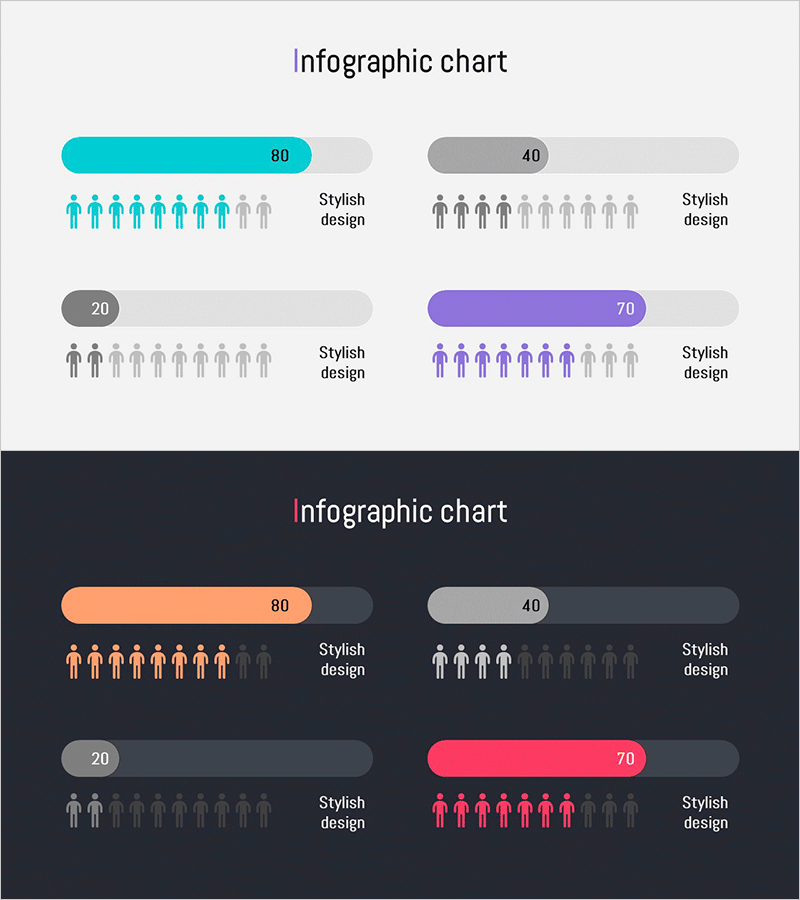
Core Exercise Donut Chart – Visualizing Performance and Development
RJ0800044_11
- Last Update 12/21/2025
- File Size 0.4MB
- # of Slides 2
- File Format PPTX
- Slide Ratio 16:9
- Color
Keywords
About the Product
This slide uses a donut chart to clearly convey core exercise data. The color scheme of red, blue, and purple gives a strong visual impression, making it suitable for presentations on performance or development status. Each donut chart emphasizes the ratio of specific values, allowing easy communication of importance and relative weight of each item. This template is ideal for business reports, proposals, and educational materials, with text and data replacement being straightforward, rated as 'easy' in editing difficulty.
Related Products
-

Elevation Graph Above Sofa Image - Visualizing Business Growth
#Business Promotion Strategy #Market and Competitor Analysis #Graph
-
Area Graph for Competitor Analysis
#Market and Competitor Analysis #Marketing Plan and Strategy #Graph
-

Smart Logistics System Slide Template – Innovative Cluster Design
#Business Promotion Strategy #Technology Sector #Diagram
-
Climbing Template Propulsion Process – Business Strategy Diagram
#Business Promotion Strategy #Diagram #Cluster
