Technology Sector
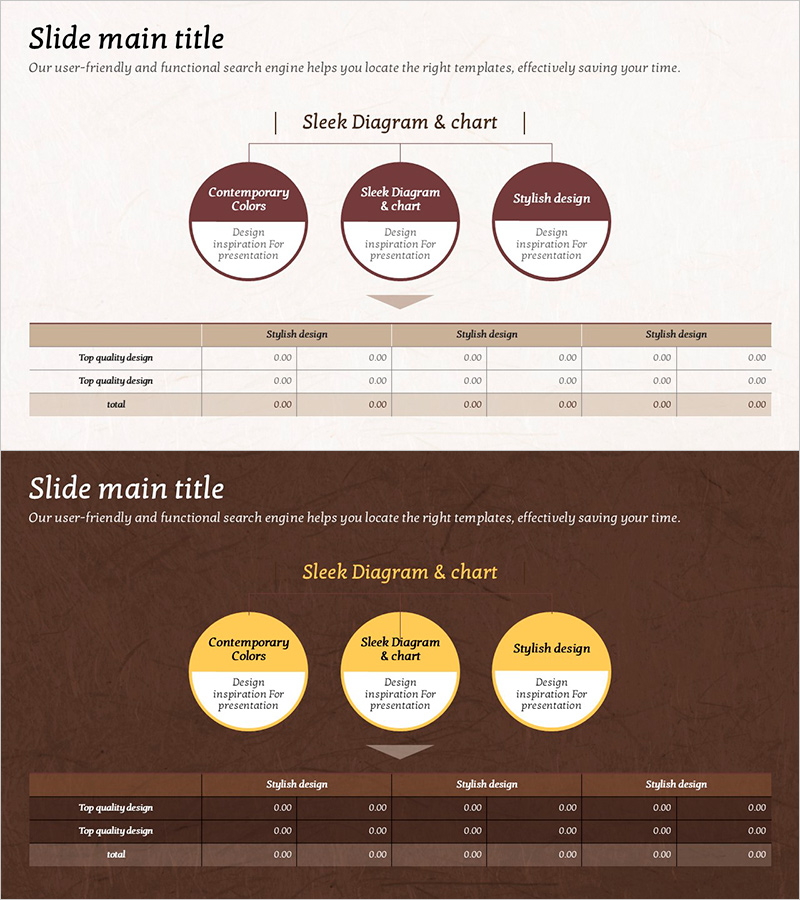
Brown Yellow Schematic and Table – Visualizing Financial Plans
RJ0800030_25
- Last Update 12/21/2025
- File Size 3.6MB
- # of Slides 2
- File Format PPTX
- Slide Ratio 16:9
- Color
Keywords
About the Product
This slide features a schematic design in brown and yellow, ideal for visualizing financial plans and performance. The structured diagram and table layout distinctly present key indicators at the top and their corresponding data below. It is effective for expressing financial data analysis and service composition. The modern design enhances the overall aesthetic and is suitable for various business presentations. Editing difficulty is rated as easy, allowing for quick adaptation to different content, making it highly practical for real-world application.
Related Products
-
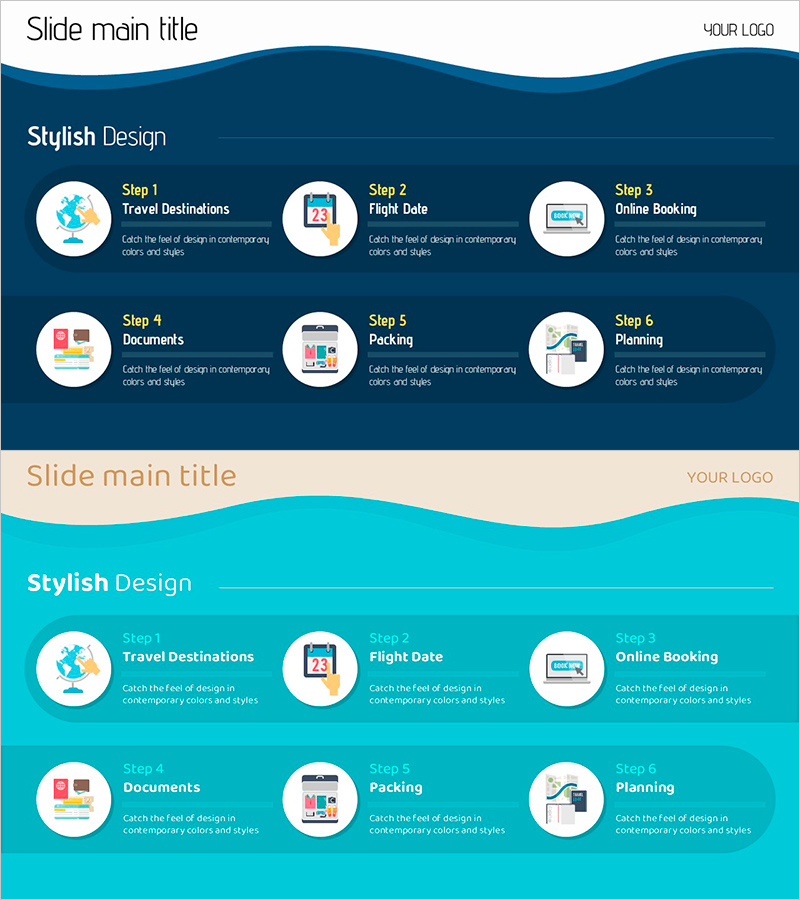
Presentation Slide Visualizing Step-by-Step Travel Plan
#Business Promotion Strategy #Diagram #Phase-wise Schedule Plan
-
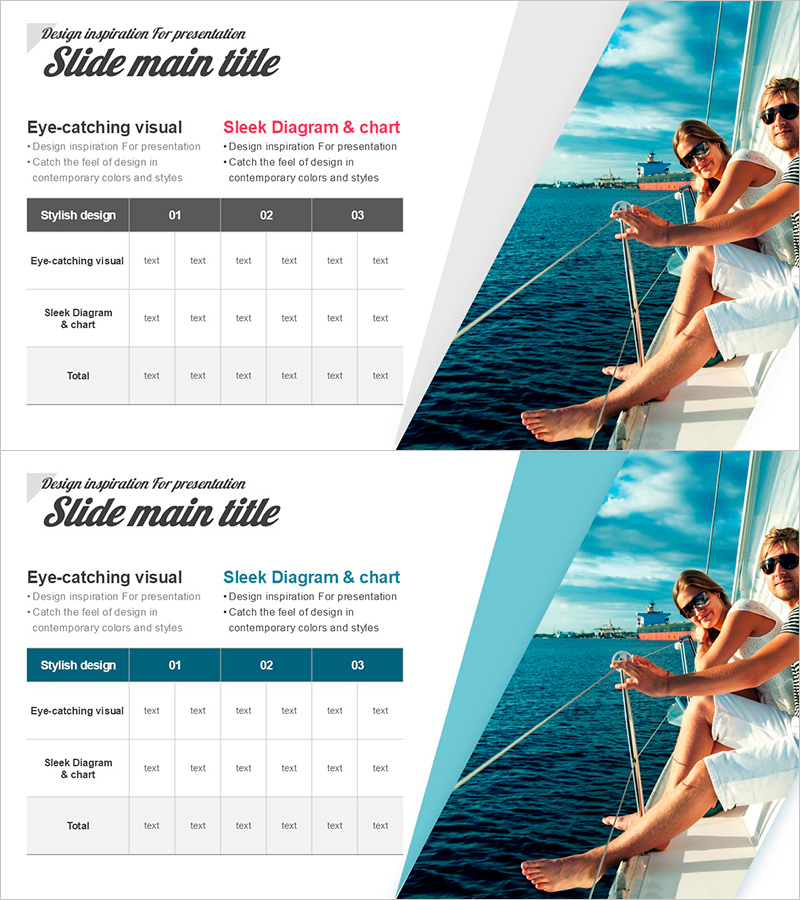
Table Comparison Slide | Structured Data Layout PPT
#Product/Service #Business Management #Diagram
-

Introduction of Observation Results – Strategies through Data Clustering
#Product/Service #Business Vision and Strategy #Diagram
-
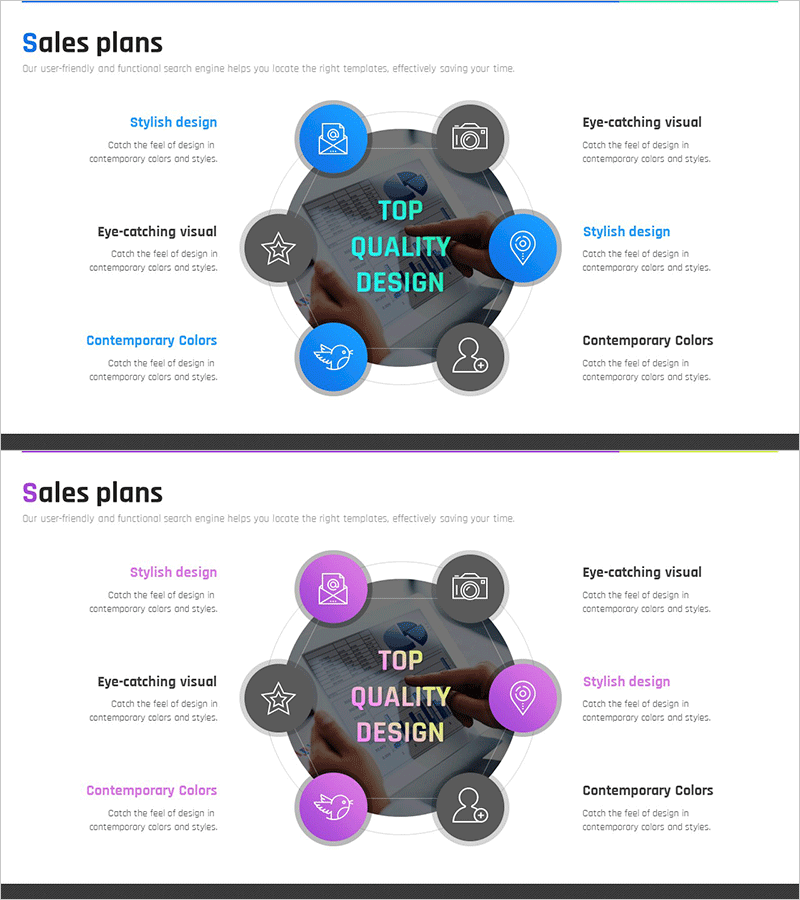
Business Area Circular Hexagon Diagram
#Business Introduction #Marketing Plan and Strategy #Diagram
