Table Comparison Slide | Structured Data Layout PPT
RJ0600098_25
- Last Update 07/17/2025
- File Size 5.6MB
- # of Slides 2
- File Format PPTX
- Slide Ratio 16:9
- Color
Keywords
- #Design-Based Slides
- #Product/Service Introduction
- #Business Management
- #Diagram
- #Composition
- #Implementation Schedule
- #Table
- #Standard Table
- #16:9
- #table slide PowerPoint
- #comparison table template
- #data organization slide
- #structured table diagram
- #product comparison slide
- #information layout template
About the Product
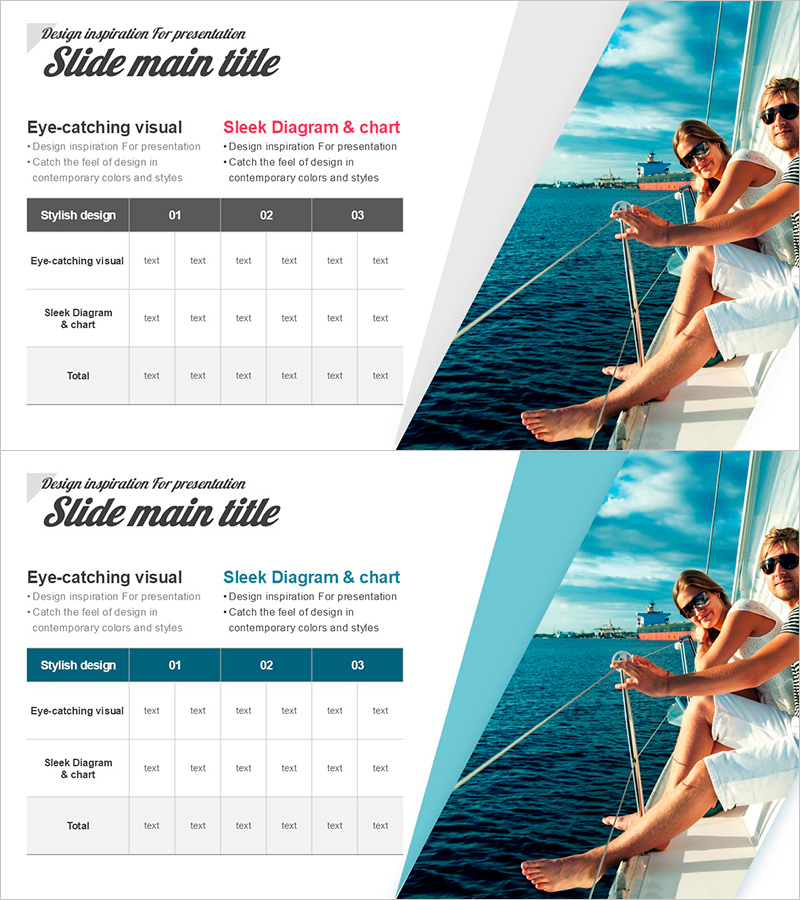
A 3-row by 6-column comparison table PowerPoint slide designed for organizing and comparing product features, services, performance metrics, and structured data. This table diagram is essential for business presentations including company profiles, proposals, and reports. The header row features a dark gray background with white text for emphasis, while data rows use light gray backgrounds to enhance readability. Each cell is ready for text input and can be customized with colors and formatting to match your presentation style.
Usage Points
-
Main Usage
This table slide is optimized for comparing multiple items such as products, services, performance results, and features side-by-side. It serves as a core data visualization tool in business documents including company overview sections, solution comparisons in proposals, and result summaries in reports.
-
How to Use
Enter comparison item names (e.g., product names, features, pricing, benefits) in the header row, then fill data rows with specific information for each item. Adjust cell background colors and text formatting to highlight key information, and expand rows or columns as needed to accommodate your data scale.
-
Recommended For
Marketing, sales, planning, and strategy professionals can use this template for product feature comparisons, competitive analysis, and service option presentations. Finance and operations teams will find it effective for performance metrics, departmental status reports, and budget item comparisons.
-
Slide Structure
A 3-row (header + 2 data rows) by 6-column table diagram structure. The header row is distinguished with a dark gray background and white text, while data rows use light gray backgrounds to create visual hierarchy. Each cell functions as an independent text input area for flexible content management.
Related Products
-

Premium Cafe Business Plan Timeline – Roadmap to Success
#Business Management #Diagram #Implementation Plan
-

Origami Presentation Template Section Schedule – Business Progress Management
#Business Management #Operational Plan #Diagram
-

Modern Wide PowerPoint Schedule – Visualization of Business Plans
#Business Management #Operational Plan #Diagram
-

Geometry PPT Template Wide Schedule – Essential for Project Management
#Business Management #Operational Plan #Diagram
