Business Promotion Strategy
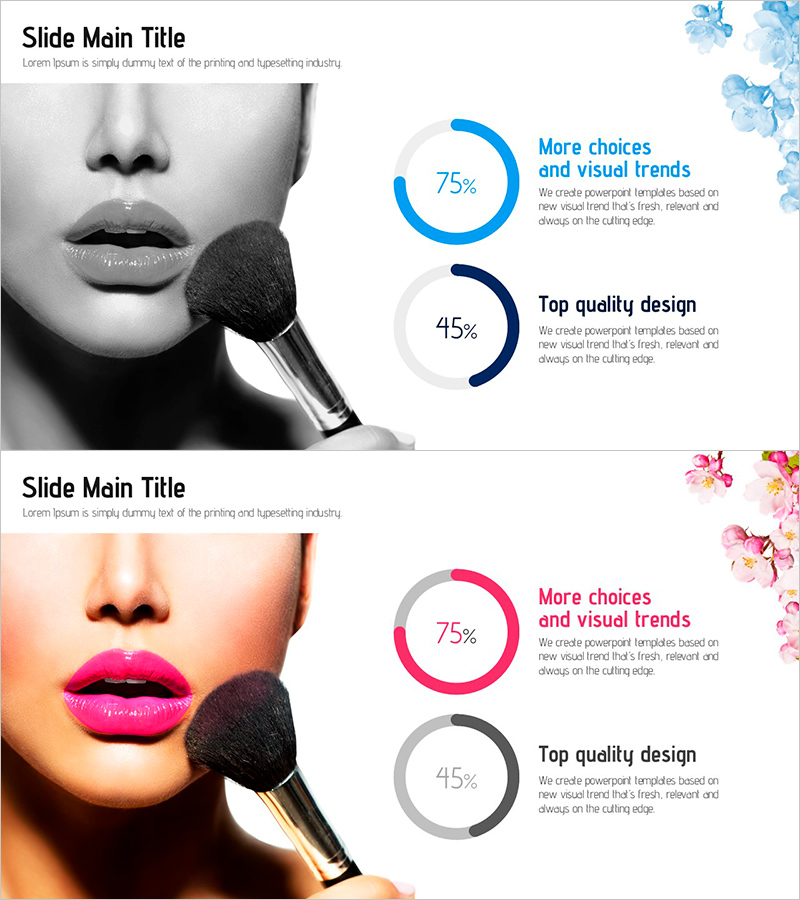
Donut Slide Visualizing Makeup Market Share
RJ0800028_5
- Last Update 12/21/2025
- File Size 5.4MB
- # of Slides 2
- File Format PPTX
- Slide Ratio 16:9
- Color
Keywords
About the Product
This slide effectively visualizes the makeup market share using a donut chart. The circular graph emphasizes the 75% and 45% data points, clearly conveying performance in the market with contrasting blue and red colors. It is ideally suited for presentations related to business strategies or meetings. Particularly appropriate for executive reports, marketing strategies, and market trend explanations, this slide is easily editable, allowing quick application across various presentations.
Related Products
-

3D Circle Graph for Competitor Analysis – Insight into Market Dynamics
#Product/Service #Market and Competitor Analysis #Graph
-
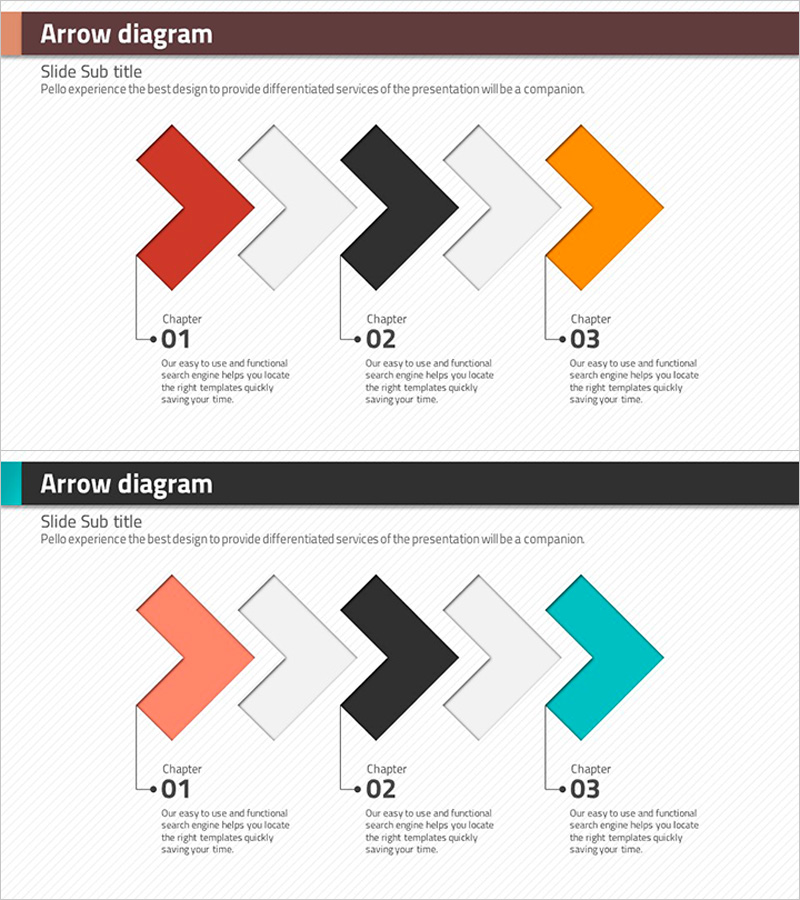
Rhombus Presentation Template Arrow Diagram – Business Strategy
#Business Promotion Strategy #Operation Plan #Diagram
-
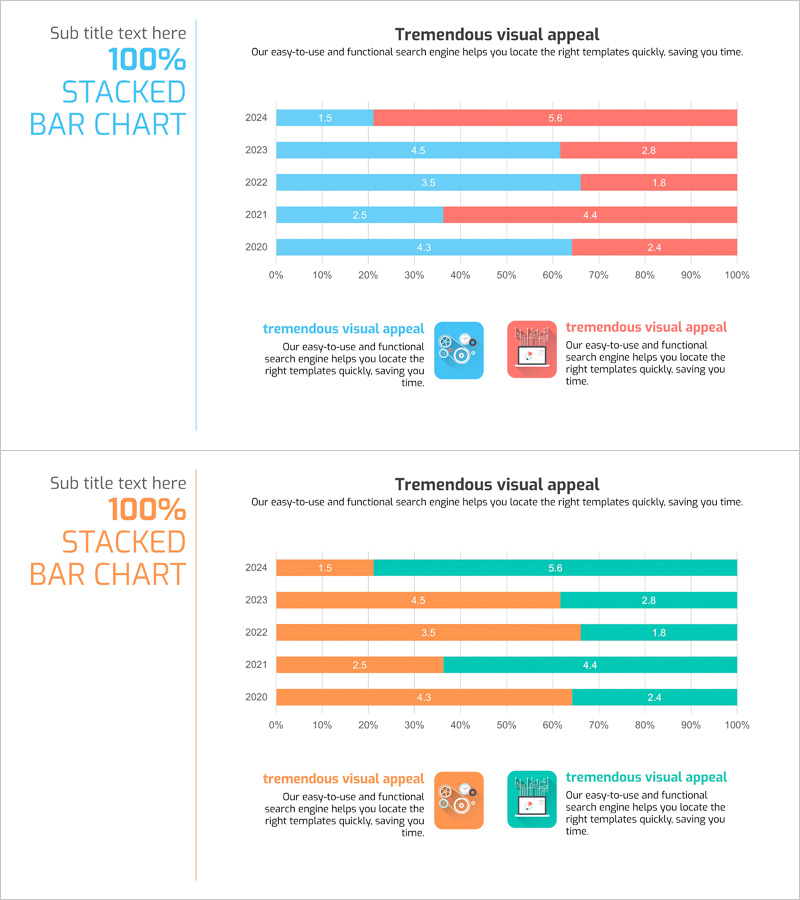
Big Data Field Analysis Graph – Horizontal Bar Chart Showing Competitive Advantage
#Market and Competitor Analysis #Graph #Competitor Analysis
-
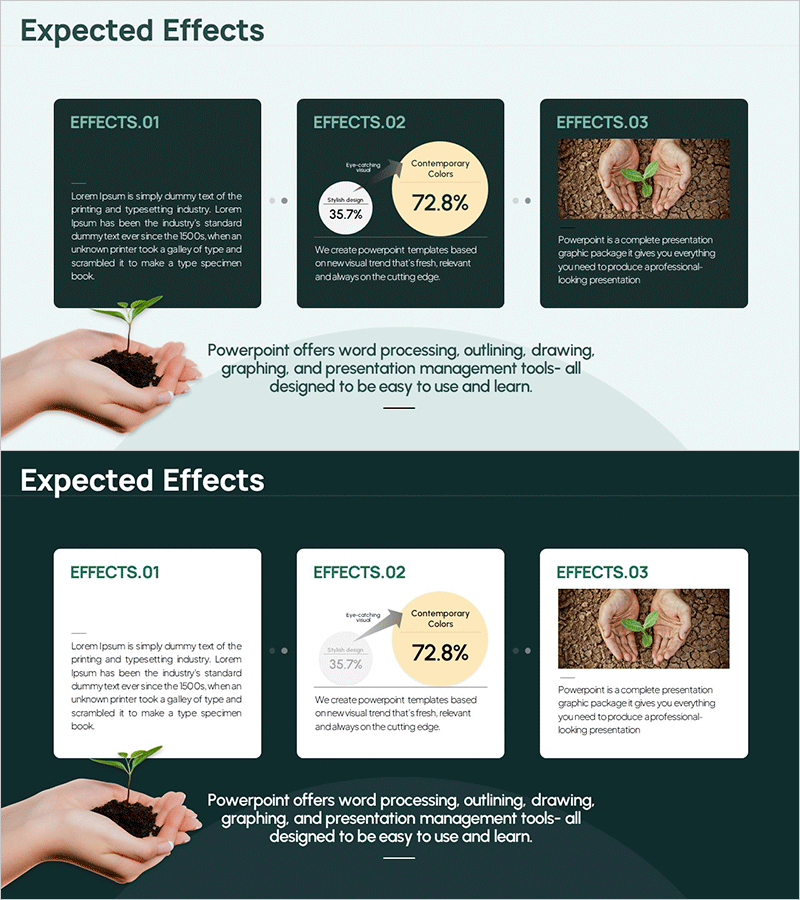
Eco Business Expected Effects Diagram
#Business Promotion Strategy #Market and Competitor Analysis #Diagram
