Diagram
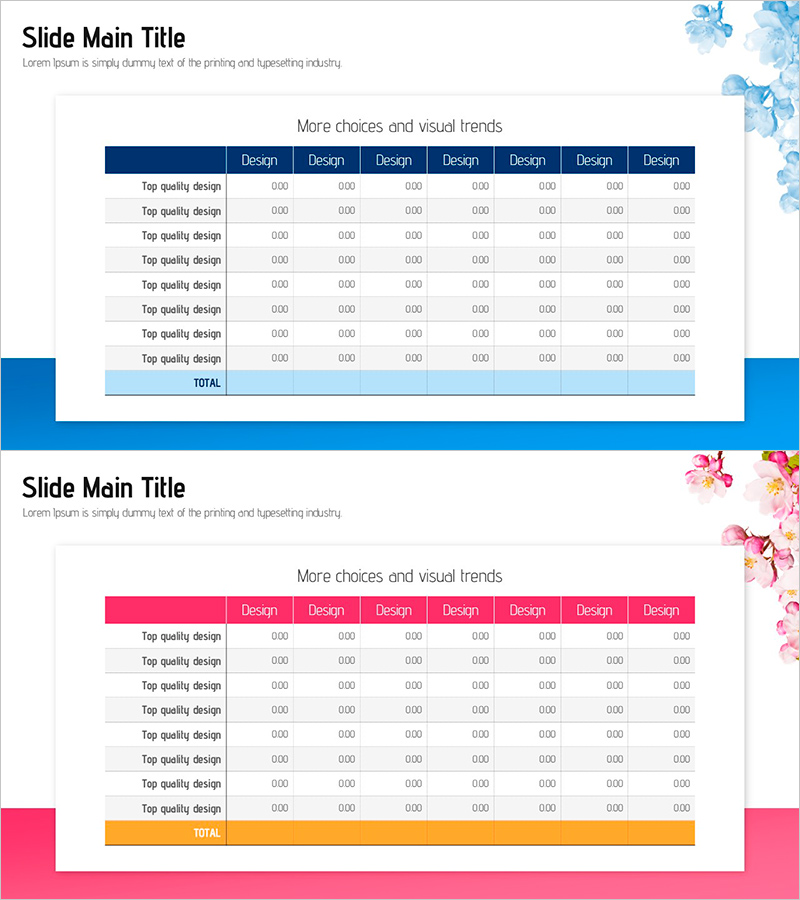
Data Trends Visualized through Diagrams – Vision and Innovation
RJ0800028_18
- Last Update 12/21/2025
- File Size 2.7MB
- # of Slides 2
- File Format PPTX
- Slide Ratio 16:9
- Color
About the Product
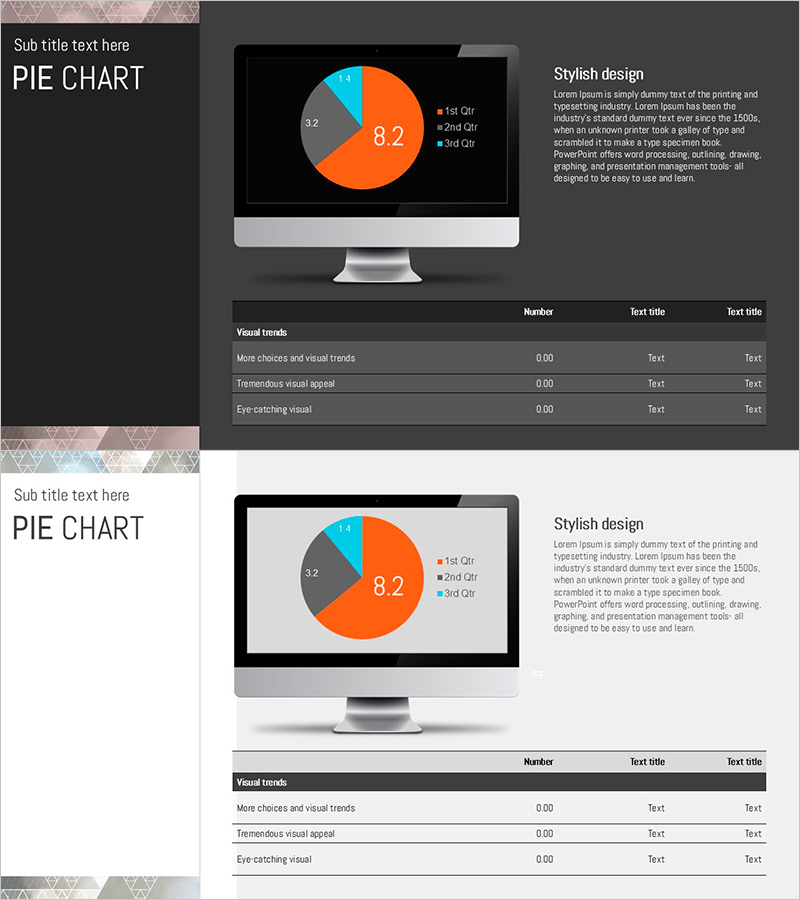
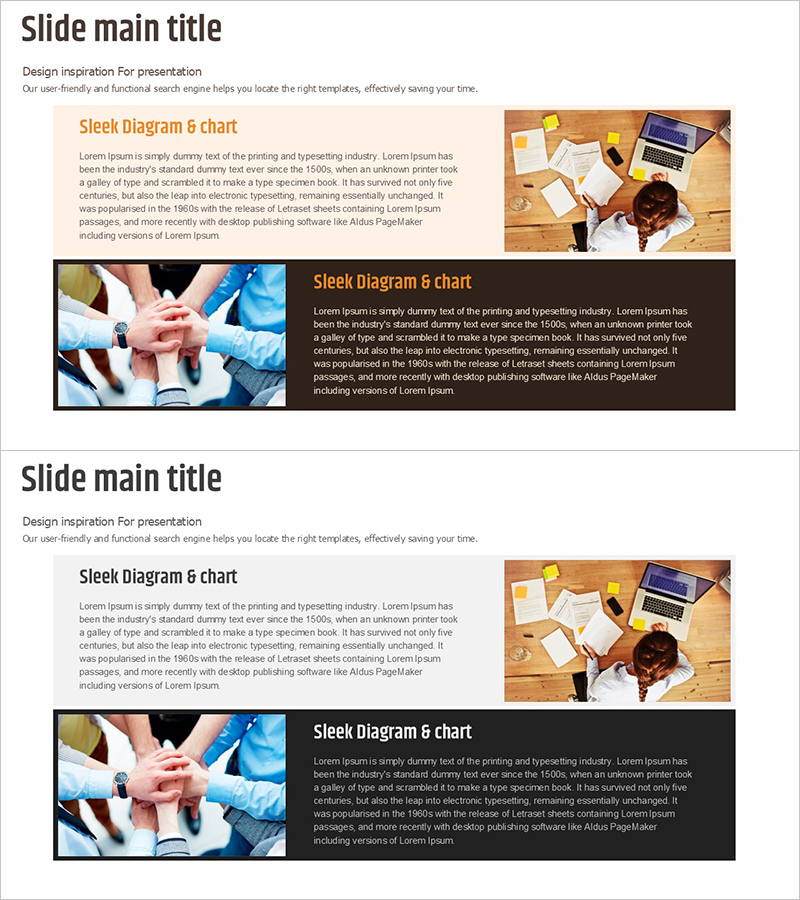
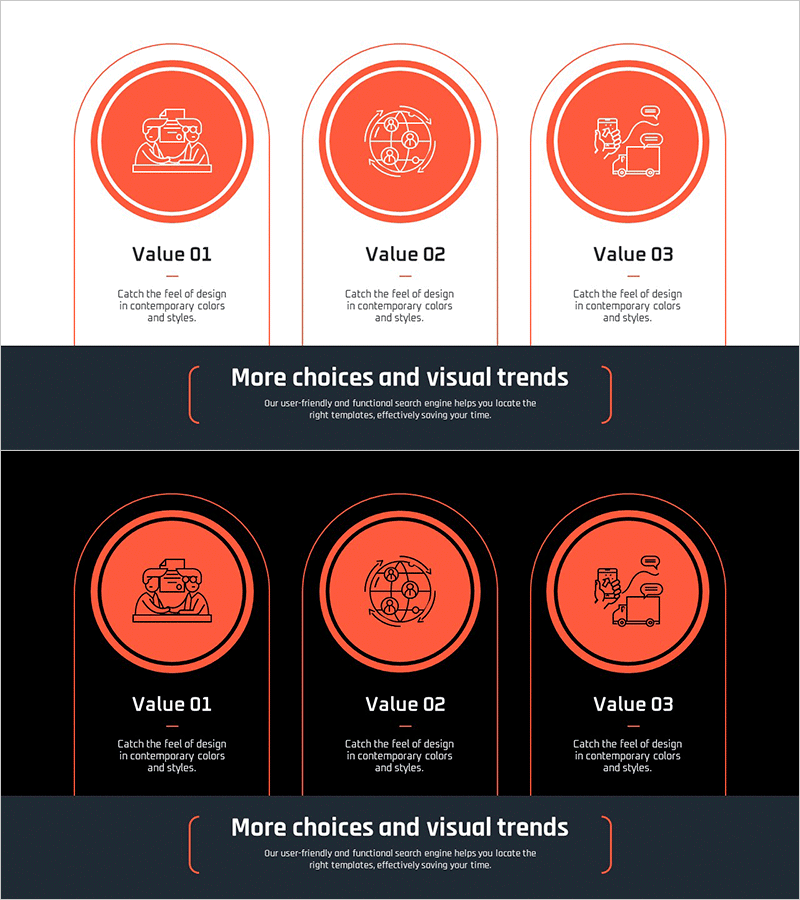
This slide effectively conveys information through a data diagram represented in a harmonious color combination. The design features blue, red, and orange, which help to distinctly highlight key points. Ideal for business analysis reports, market research findings, or educational materials. Users can easily replace or add different components in the slide, with a design editing difficulty rated as 'easy' for quick application across various contexts.
Related Products
-
Triangular Pattern Presentation Template Pie Chart – Market Analysis and Strategy
#Market and Competitor Analysis #Financial Plans and Performance #Diagram
-
Brown Gray Marketing Plan Box - Business Strategy
#Business Promotion Strategy #Marketing Plan and Strategy #Diagram
-
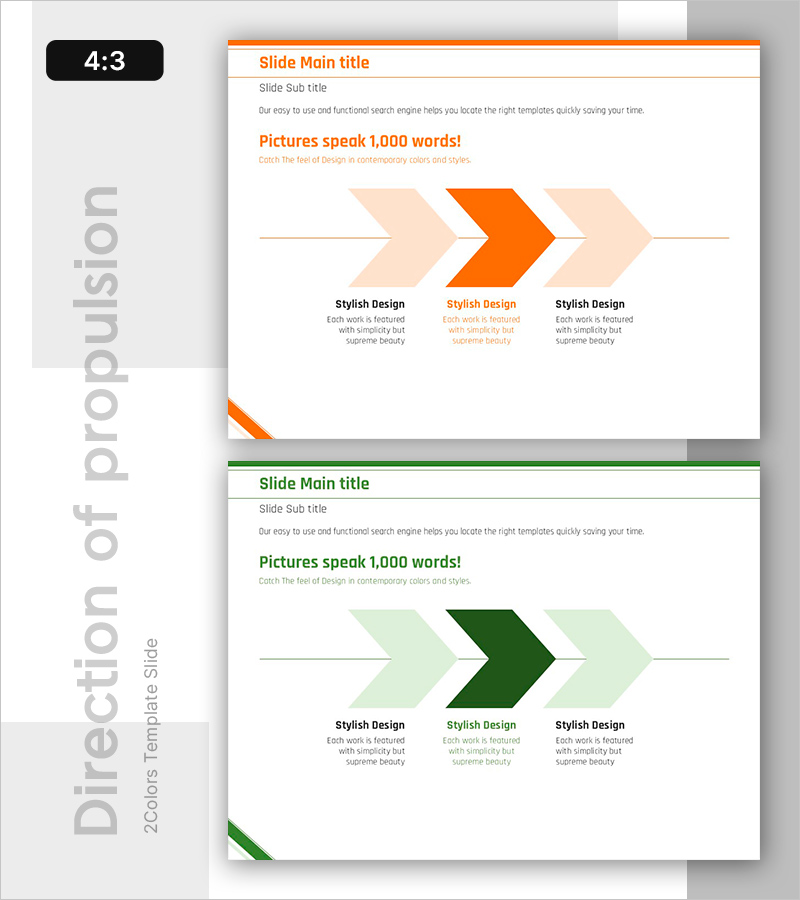
Process toward the Goal – Visualizing Business Direction
#Business Promotion Strategy #Diagram #Business Direction
-
Visual Diagram for Global Export Business Vision
#Business Vision and Strategy #Diagram #Business Vision
