Market and Competitor Analysis
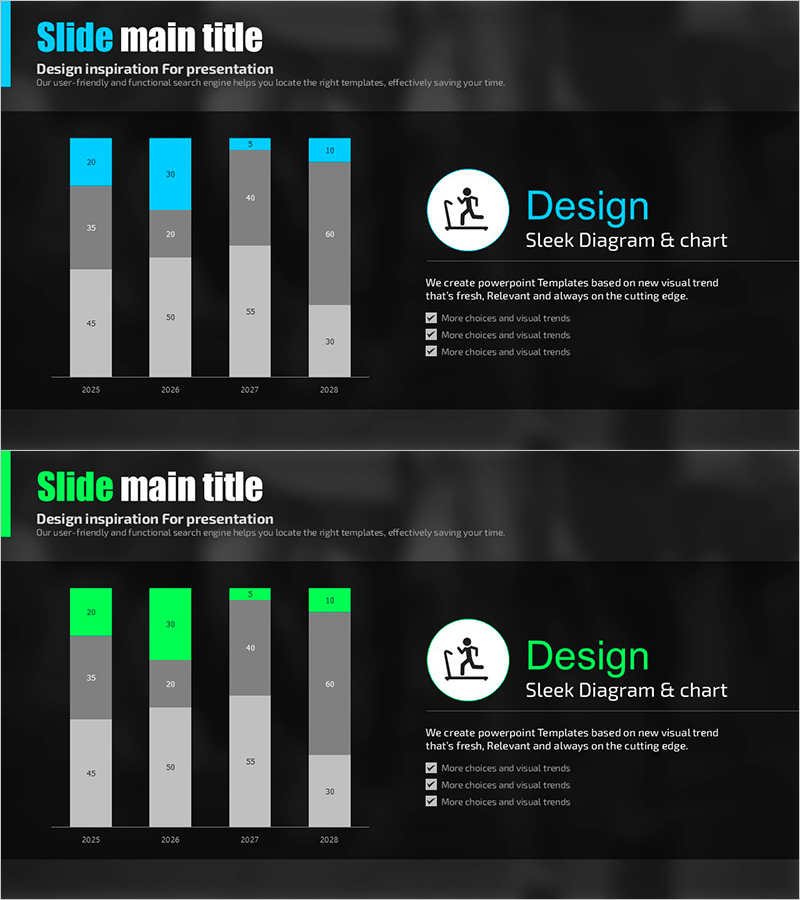
Body Fat Change After Running – Market Analysis
RJ0800024_5
- Last Update 12/21/2025
- File Size 1MB
- # of Slides 2
- File Format PPTX
- Slide Ratio 16:9
- Color
Keywords
About the Product
This PowerPoint slide visualizes data regarding body fat change after running using horizontal and vertical bar graphs. The modern design and user-friendly layout highlight the years 2025 to 2028 clearly. The harmonious combination of blue and green colors provides visual stability, making it suitable for customer analysis and market trends. This slide can be effectively utilized in presentations related to the health and fitness industry and annual performance analysis. The graphs and text are easily replaceable, with an average editing difficulty.
Related Products
-

Business Future Outlook Diagram
#Technology Sector #Market and Competitor Analysis #Diagram
-
Age-based Market Share Analysis with Pie Chart
#Market and Competitor Analysis #Graph #Market Share
-
Investigation on the Ratio of Male and Female Traffic Accidents – Gender Analysis
#Market and Competitor Analysis #Graph #Other
-
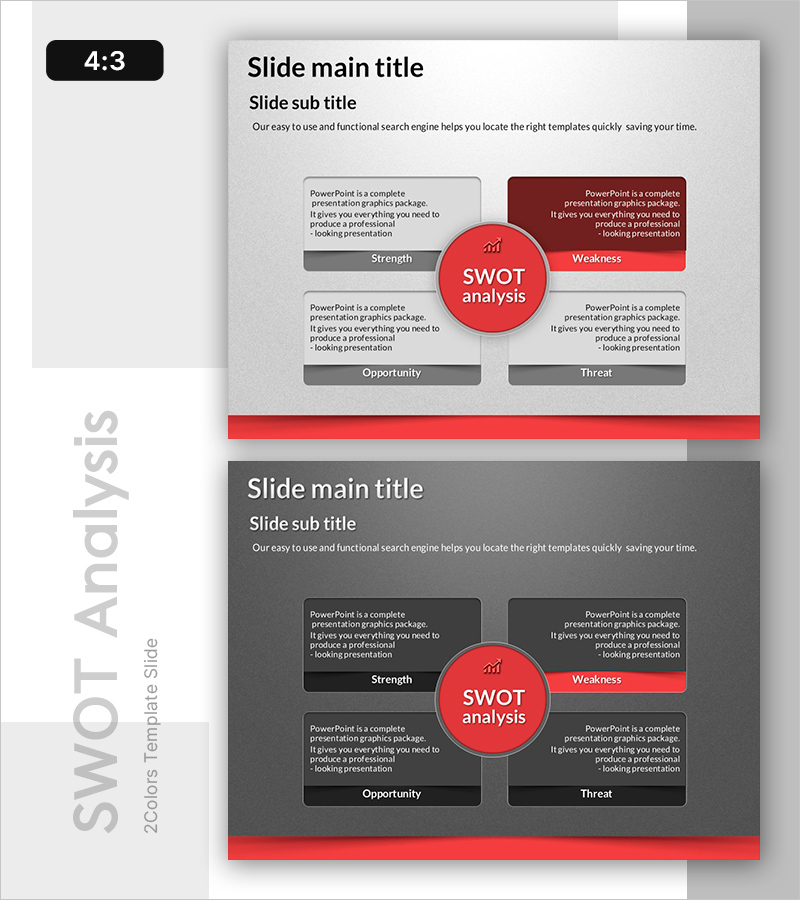
Strategic Financial Growth through SWOT Analysis - Insights for Success
#Operation Plan #Market and Competitor Analysis #Diagram
