Technology Sector
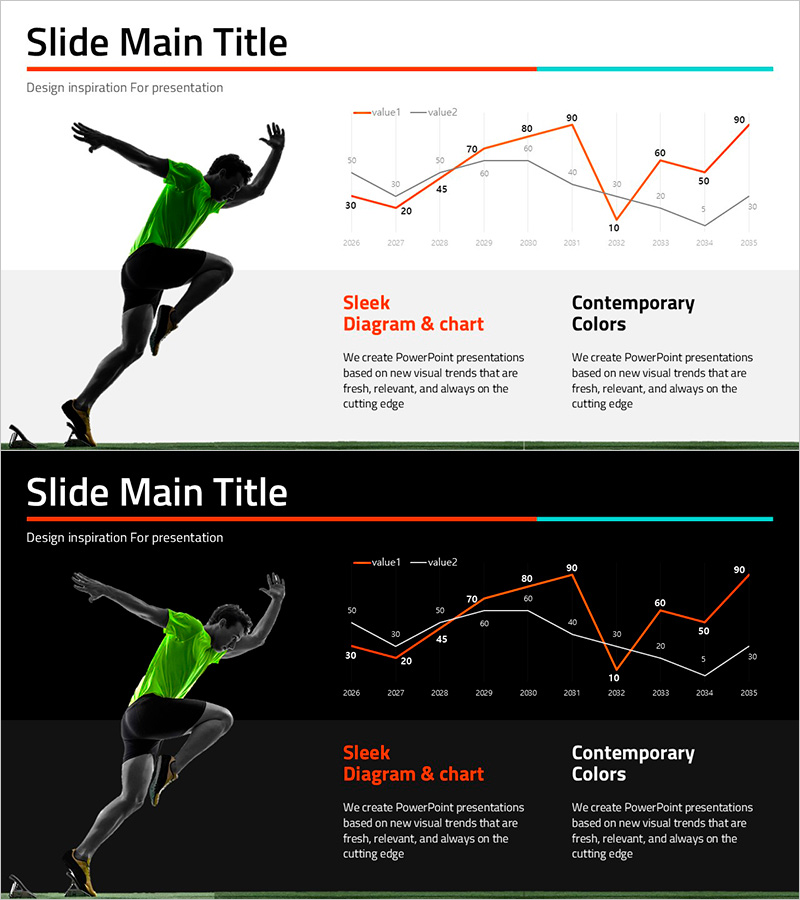
Run Effect Line Chart for Market and Competitor Analysis – Gain Competitive Edge
RJ0800021_17
- Last Update 12/21/2025
- File Size 2.8MB
- # of Slides 2
- File Format PPTX
- Slide Ratio 16:9
- Color
Keywords
About the Product
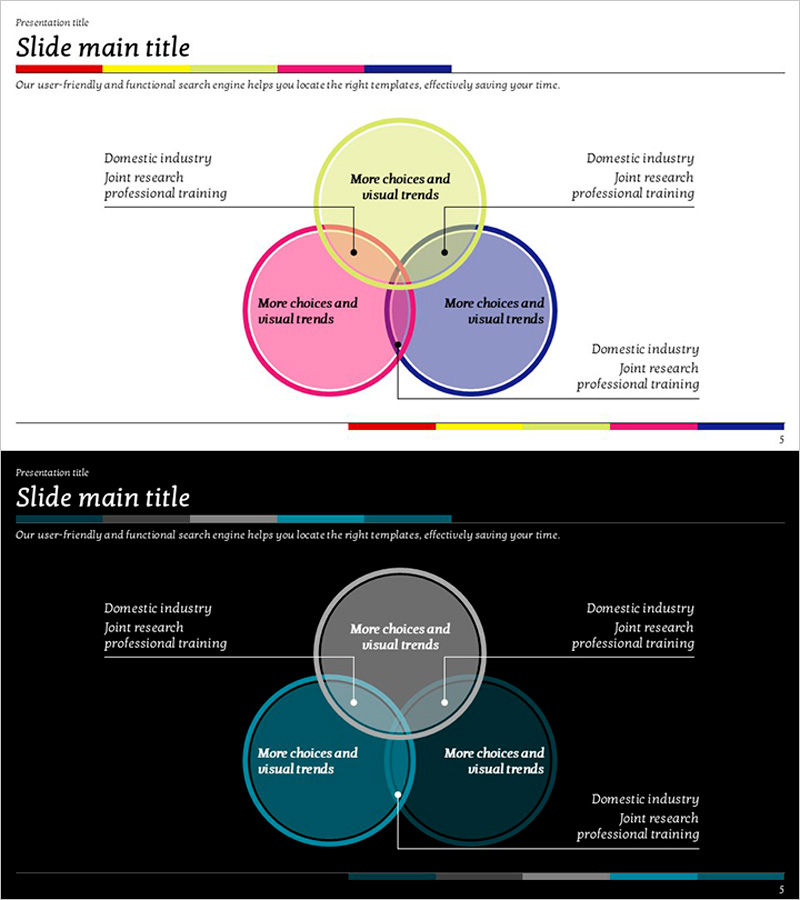
This slide template features a line chart visualizing the run effect to assist in market and competitor analysis. The vivid red and green color scheme enhances visual impact while clearly conveying information. It's optimized for presentations aiming to propose future developments in the technical sector and establish a competitive edge. This slide allows easy replacement of text and data, rated 'easy' for editing, ensuring swift application in practical settings.
Related Products
-
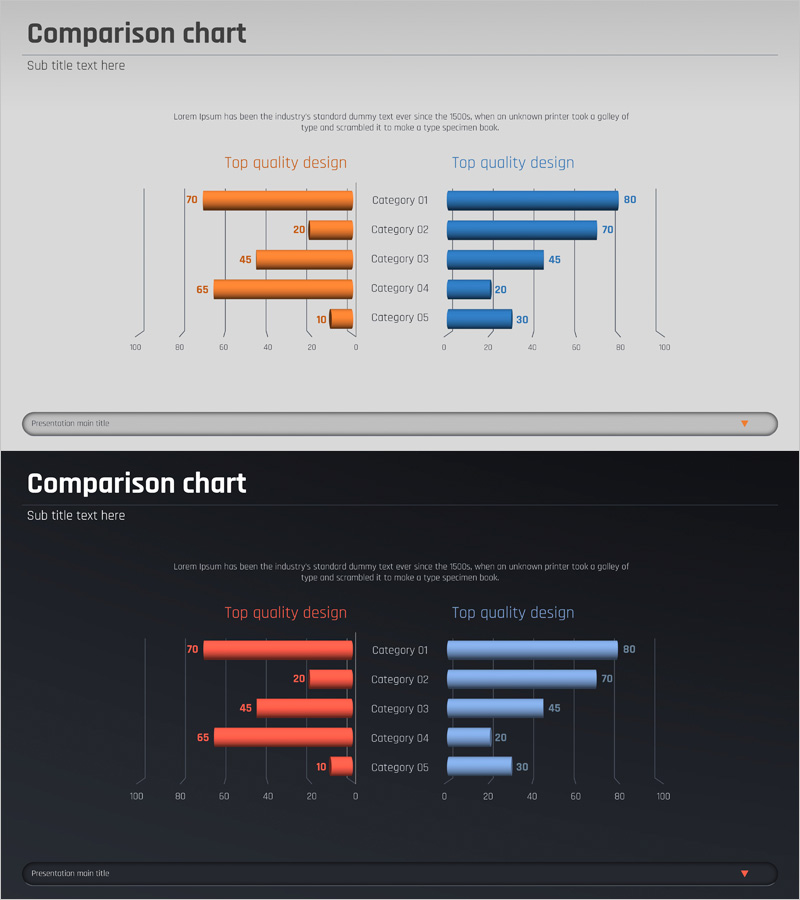
Competitive Advantage 3D Bi-directional Bar Graph – Essential Tool for Market Analysis
#Market and Competitor Analysis #Graph #Competitor Analysis
-
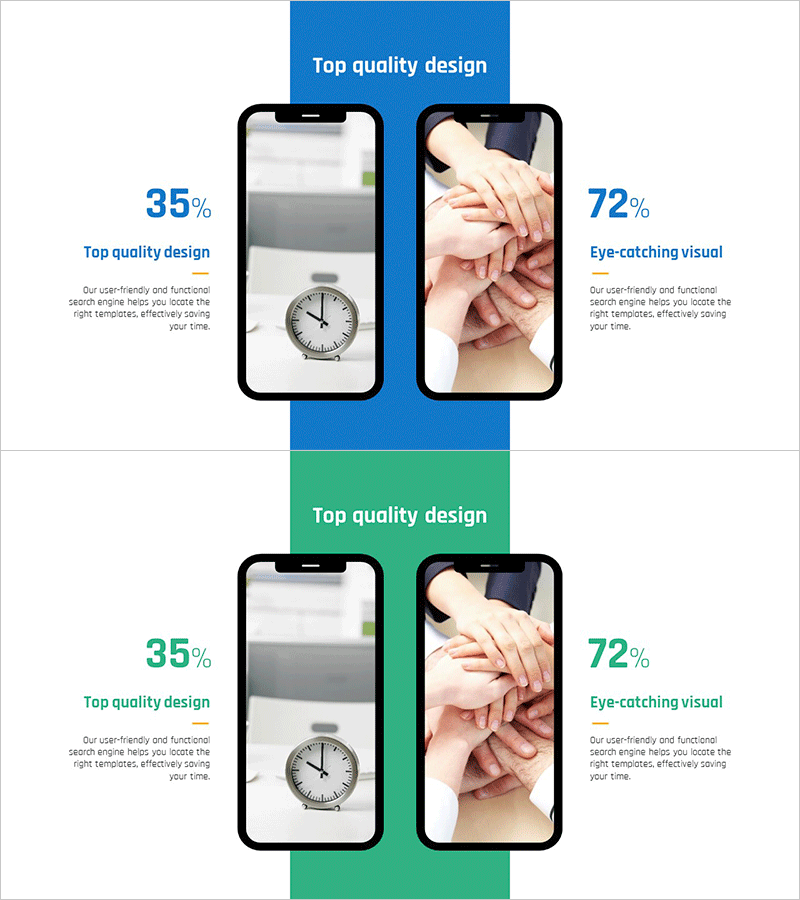
Comparative Analysis Mobile Phone Mockup Graph – Market Competitive Advantage
#Market and Competitor Analysis #Other #Competitor Analysis
-
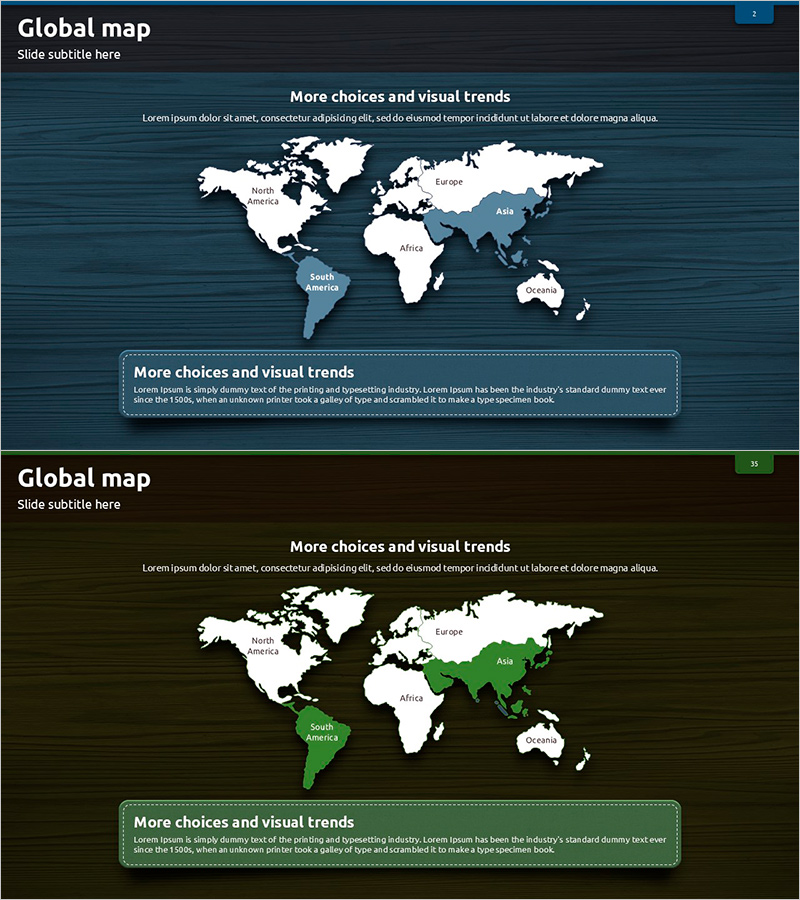
Blue Green Target Area Analysis – Optimized Template for Market and Competition Analysis
#Market and Competitor Analysis #Other #Target Market
-
Tricolor Overlapping Diagram – Business Strategy Representation
#Business Vision and Strategy #Technology Sector #Diagram
