Company Introduction
Visualizing Research Results and Objectives – Strong Strategy and Vision
RJ0700026_27
- Last Update 12/21/2025
- File Size 0.4MB
- # of Slides 2
- File Format PPTX
- Slide Ratio 16:9
- Color
Keywords
About the Product
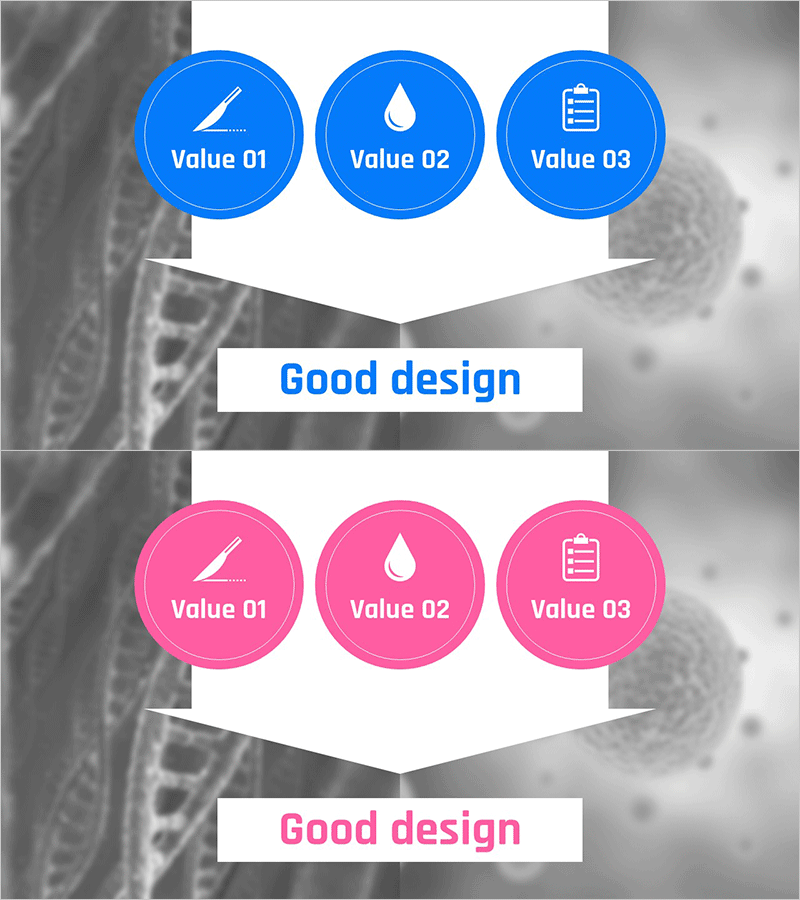
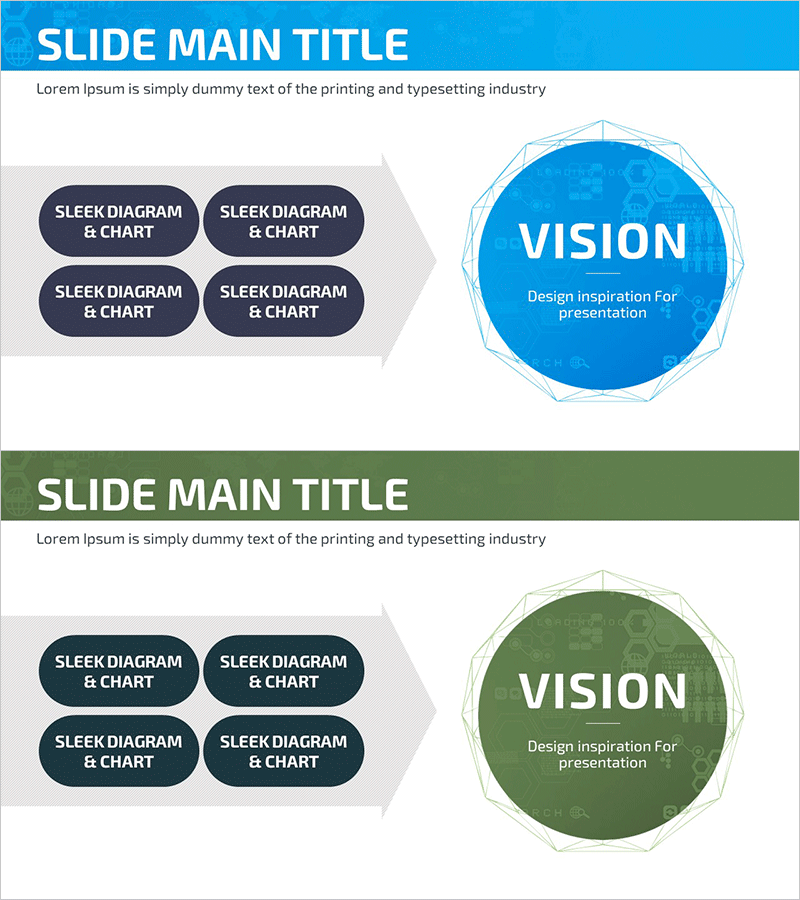
This slide is designed to effectively present and visualize research results and objectives. Utilizing flow diagrams and text boxes, it clearly conveys information while harmonizing blue and red to convey trust and enthusiasm. The emotional message of 'Good Design' reinforces the presenter's determination. It can be used in various business scenarios such as establishing corporate research objectives and core values. The editing difficulty is rated as 'easy', allowing for convenient changes to text and graphic elements.
Related Products
-
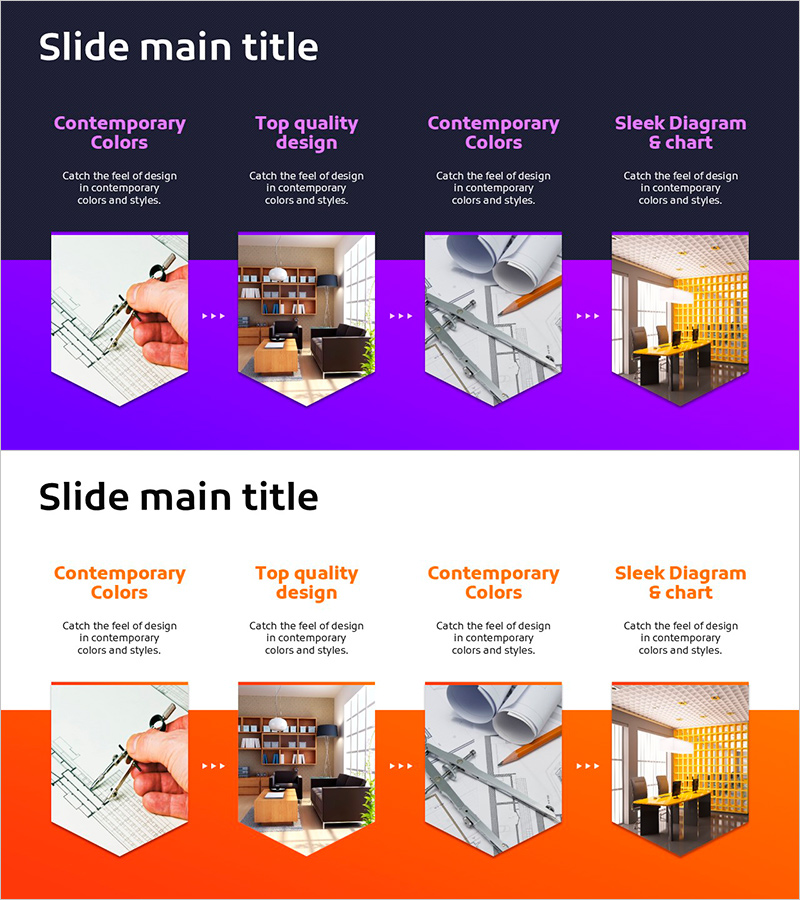
Visualizing Product Development Planning Process with Diagram Slide
#Business Promotion Strategy #Operation Plan #Diagram
-
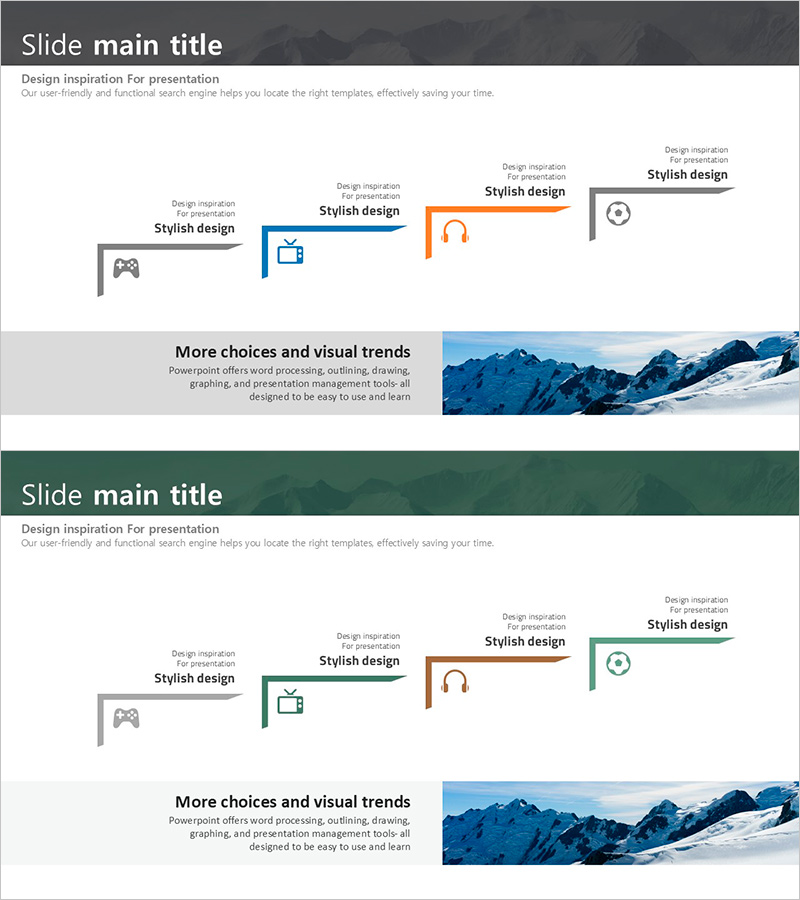
Step-by-Step Mountaineering Diagram – Systematic Visualization of Marketing Strategies
#Marketing Plan and Strategy #Diagram #Marketing Strategy
-
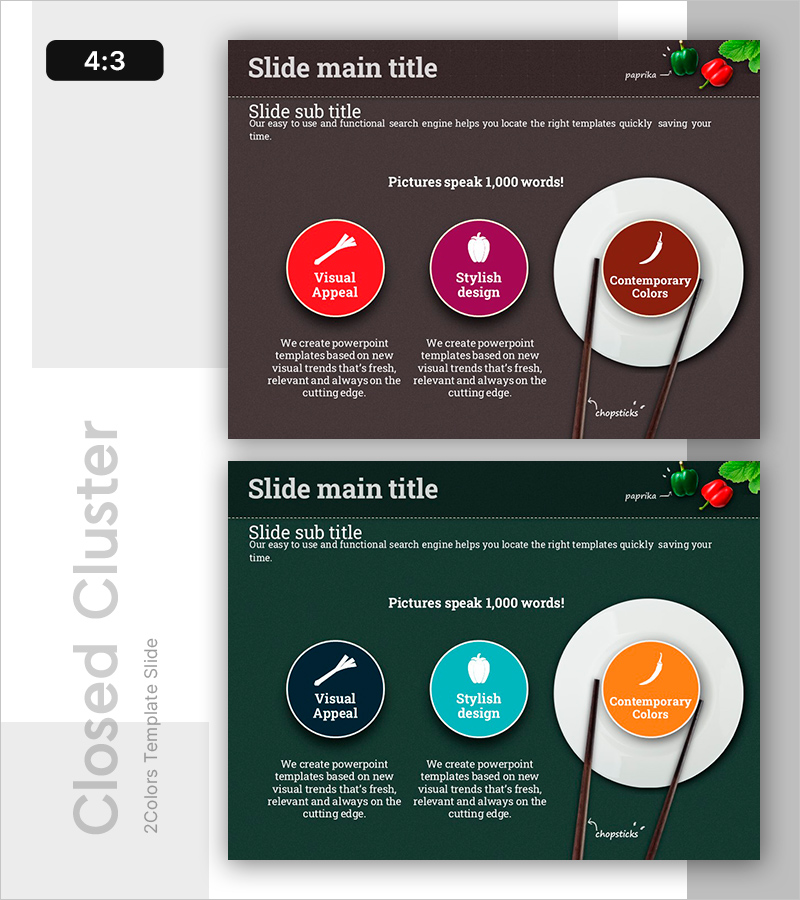
Analysis of Ingredient Preference – Data Visualization Slide
#Product/Service #Diagram #Differentiation Strategy for Products/Services
-
Successful Business Vision Diagram – Communicating Corporate Vision
#Company Introduction #Business Vision and Strategy #Diagram
