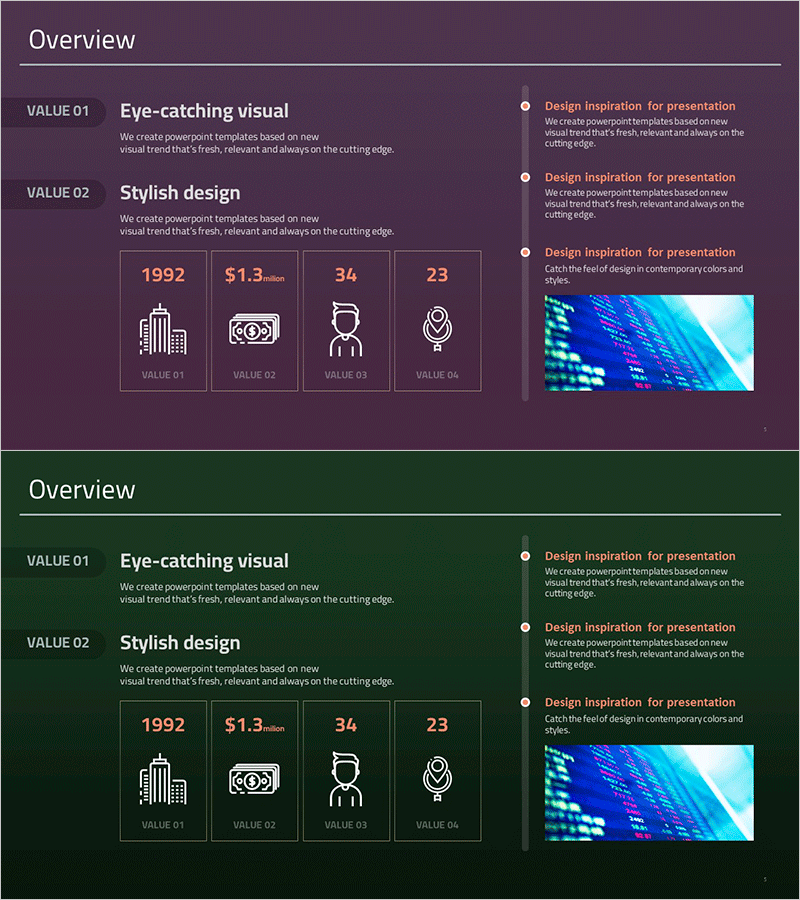
Business Vision and Strategy
Experimental Results Summary Diagram
RJ0700019_18
- Last Update 12/21/2025
- File Size 0.8MB
- # of Slides 2
- File Format PPTX
- Slide Ratio 16:9
- Color
Keywords
About the Product
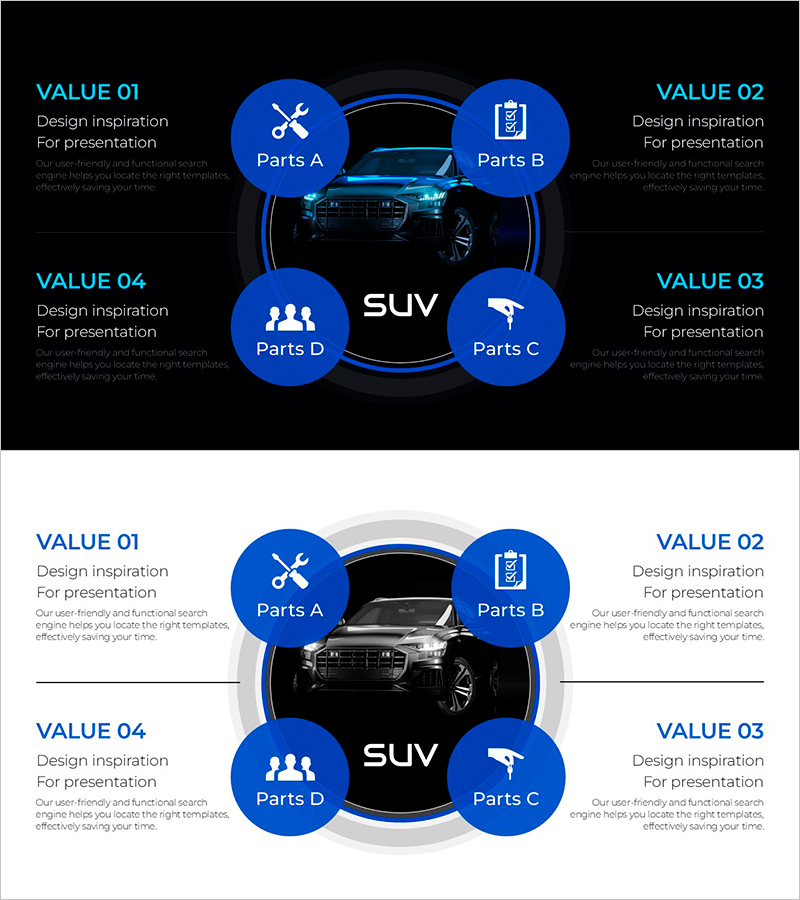
This slide is optimized for visually summarizing experimental results. Featuring a unique cluster design, it effectively compares and analyzes a variety of outcomes, making it ideal for research presentations or business strategy documents. The combination of blue and purple colors conveys both trust and creativity, capturing the audience's attention while leaving a professional impression. This template is perfect for clearly displaying research findings, market analysis, and marketing objectives, particularly in scientific, technological, and marketing fields.
Related Products
-
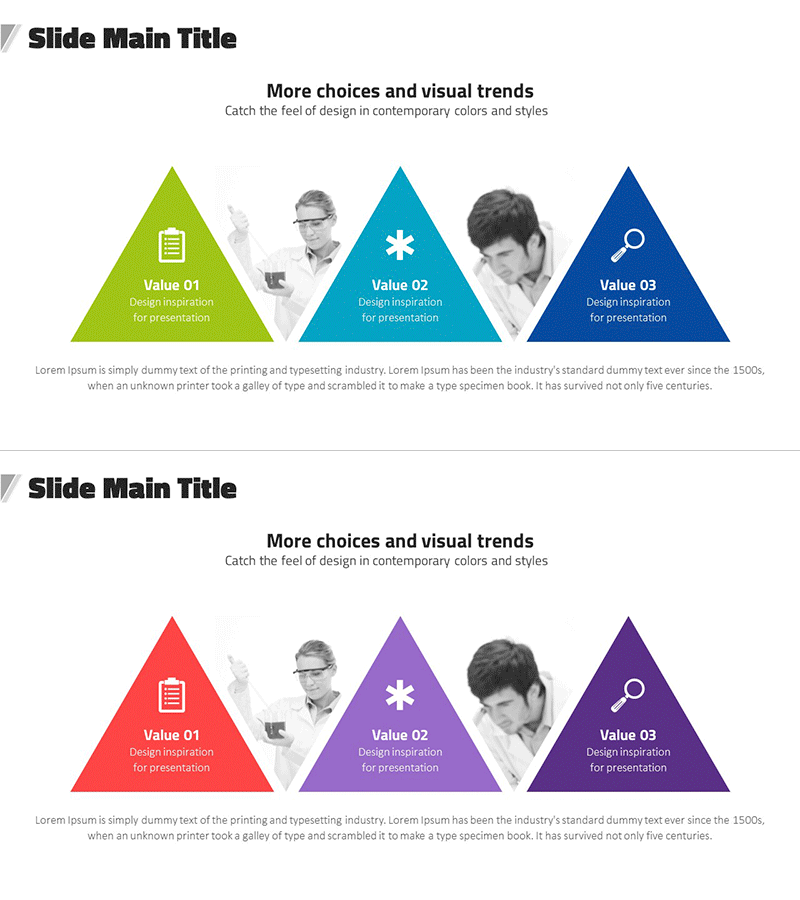
Introduction to Business Core Values and Direction – Cluster and Closed Diagram
#Company Introduction #Business Introduction #Diagram
-
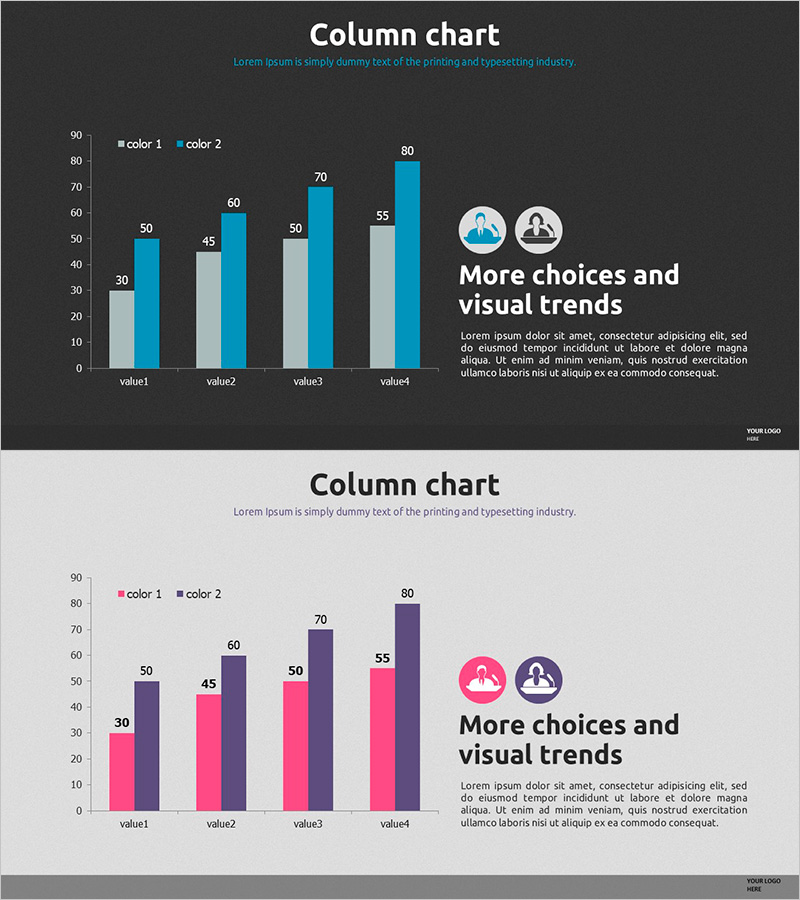
Customer Analysis Bundled Vertical Bar Chart – A Clear View of Market Trends
#Market and Competitor Analysis #Marketing Plan and Strategy #Graph
-
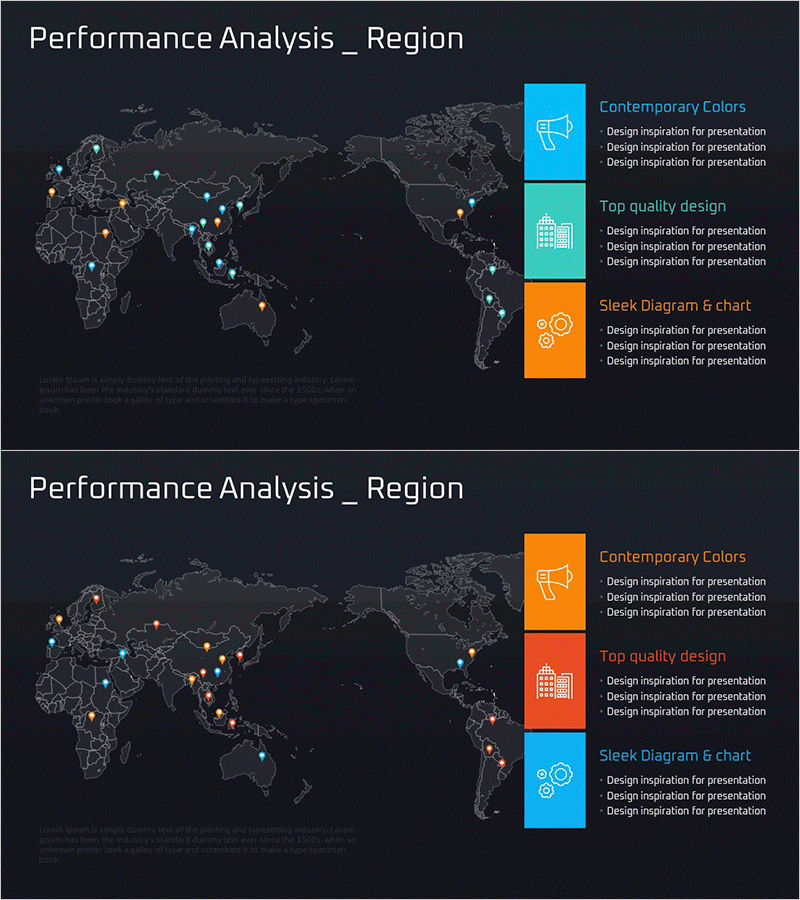
Setting Global Target Regional Strategies – Visualized with Sleek Diagrams and Clusters
#Company Introduction #Marketing Plan and Strategy #Diagram
-
Automobile Management System Slide – Effective Business Strategy
#Product/Service #Business Vision and Strategy #Diagram
