Setting Global Target Regional Strategies – Visualized with Sleek Diagrams and Clusters
RM0600004_14
- Last Update 02/24/2025
- File Size 0.8MB
- # of Slides 2
- File Format PPTX
- Slide Ratio 16:9
- Color
Keywords
- #Content-Based Slides
- #Design-Based Slides
- #Company Introduction
- #Marketing Plan and Strategy
- #Diagram
- #Other
- #Global Network
- #Target Market Strategy
- #Cluster
- #Closed Cluster Diagram
- #Map
- #16:9
- #world map PowerPoint slide
- #regional analysis presentation template
- #global performance visualization
- #multi-region data chart
- #world map diagram PPT download
About the Product
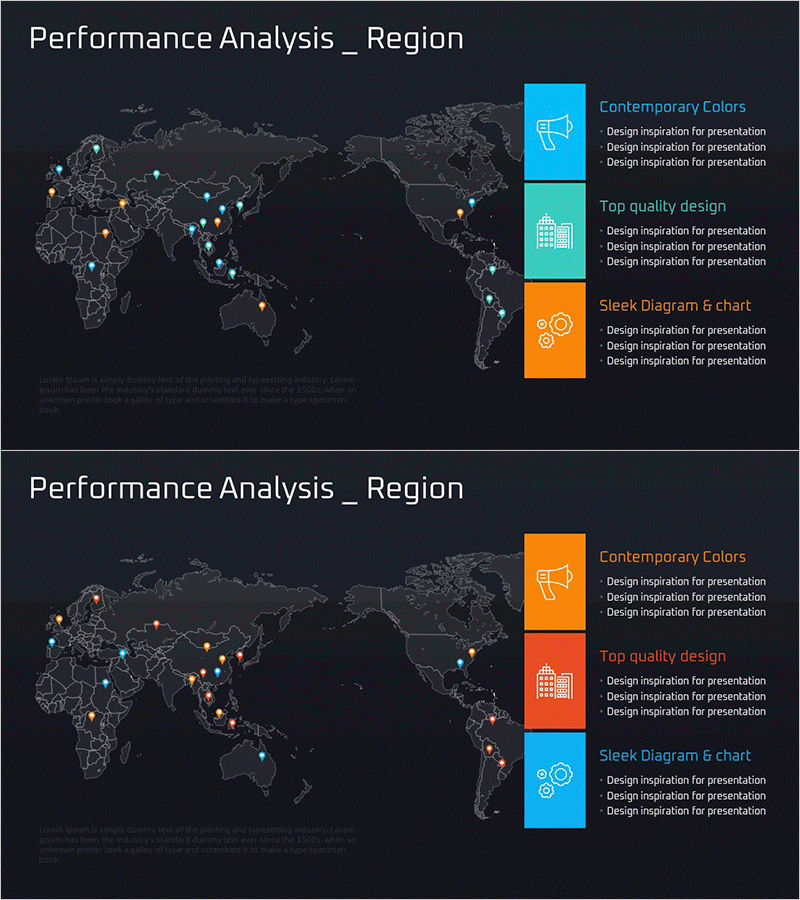
A world map-based PowerPoint slide for visualizing global market analysis and regional performance metrics. The design features a dark background with cyan and orange data point markers distributed across continents, complemented by a right-aligned legend displaying three categories (Contemporary Colors, Top quality design, Sleek Diagram & chart) with corresponding icons. The 2-slide set enables side-by-side comparison of regional strategies, marketing performance, and global target achievement. Formatted in 16:9 widescreen ratio for modern presentation environments. Ready to use in executive presentations, quarterly reports, and strategic planning meetings.
Usage Points
-
Main Usage
Visualize global market expansion strategies, regional sales performance, and international project progress using map-based graphics. Enable executives and team members to instantly grasp multi-region data comparisons and regional performance gaps.
-
How to Use
Click data point markers on the world map to input region names, metrics, and categories. Edit legend text to customize analysis categories. Insert into market analysis or performance sections of marketing, sales, or executive reports to emphasize global strategy.
-
Recommended For
International business managers, marketing strategy teams, executive report writers, global project managers, regional sales analysts, overseas expansion planners, and cross-functional teams presenting global performance metrics.
-
Slide Structure
Slide 1: World map with 15-20 cyan and orange data point markers distributed globally + right-aligned legend with 3 categories and icons. Slide 2: Identical layout with reversed color scheme (orange and cyan swapped). 16:9 widescreen, PPTX format, all elements fully editable.
Related Products
-

Global Competitive Regional Market Analysis Slide – Strategic Marketing Tool
#Company Introduction #Marketing Plan and Strategy #Diagram
-

Market Analysis for Achieving Highest Sales Strategy
#Company Introduction #Marketing Plan and Strategy #Diagram
-

Global Photo Shoot Spots Map – Visual Material Supporting Effective Marketing Strategies
#Company Introduction #Marketing Plan and Strategy #Diagram
-

Global Network Analysis – Business Strategy and Target Market
#Company Introduction #Marketing Plan and Strategy #Diagram
