Technology Sector
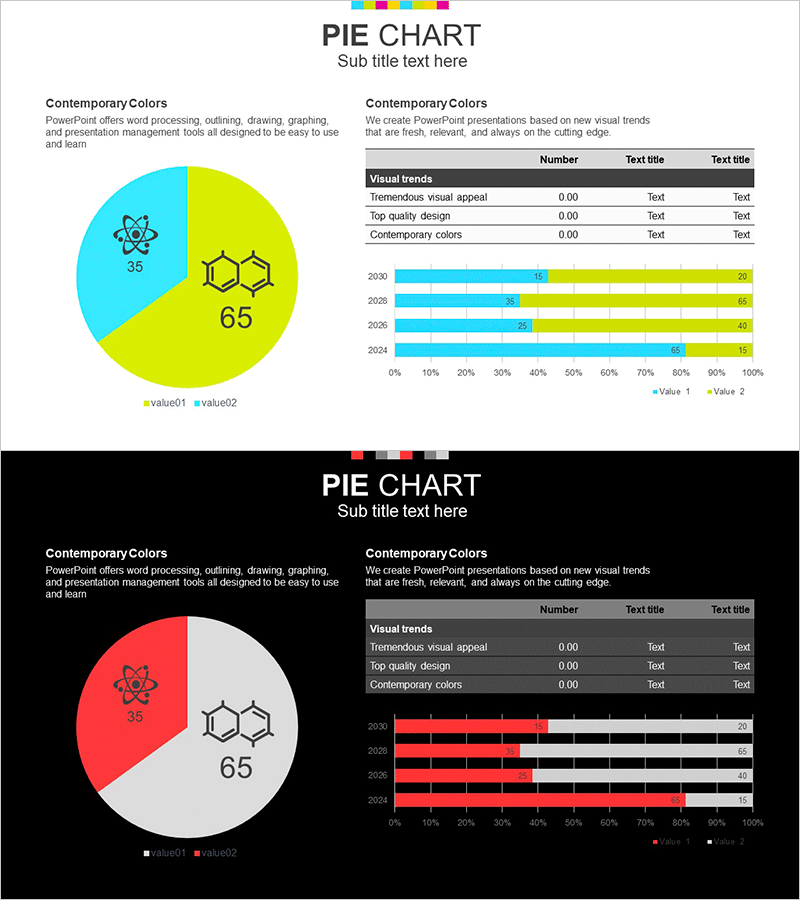
Chemical Experiment Analysis Graph Chart – Visualizing R&D Achievements
RJ0700008_19
- Last Update 12/21/2025
- File Size 1.2MB
- # of Slides 2
- File Format PPTX
- Slide Ratio 16:9
- Color
Keywords
- #Content-Based Slides
- #Design-Based Slides
- #Technology Sector
- #Market and Competitor Analysis
- #Diagram
- #Graph
- #Research and Development
- #Market Analysis
- #Table
- #Horizontal Bar
- #Circles
- #Standard Table
- #Segmented Horizontal Bar
- #Pie Chart
- #16:9
- #chemical experiment
- #analysis
- #graph chart
- #market and competitive analysis
About the Product
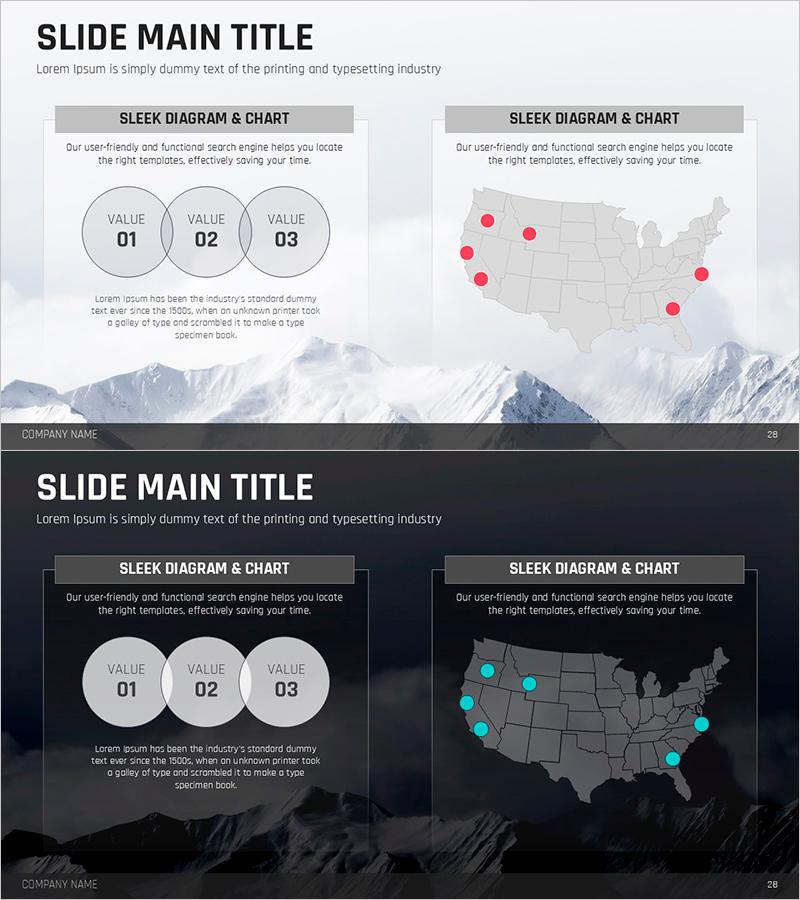
This slide offers a graph chart that effectively displays chemical experiment analyses. It assists in intuitively visualizing research and development results as well as market data. The design based on black and white conveys a clear and professional atmosphere, enabling users to communicate technical information easily. This slide is suitable for presentations related to the technology sector and market analysis, featuring stacked graphs and pie charts that facilitate data comparison. Users can easily replace the slide contents, and the editing difficulty is rated as 'easy,' allowing for quick utilization in various presentations.
Related Products
-
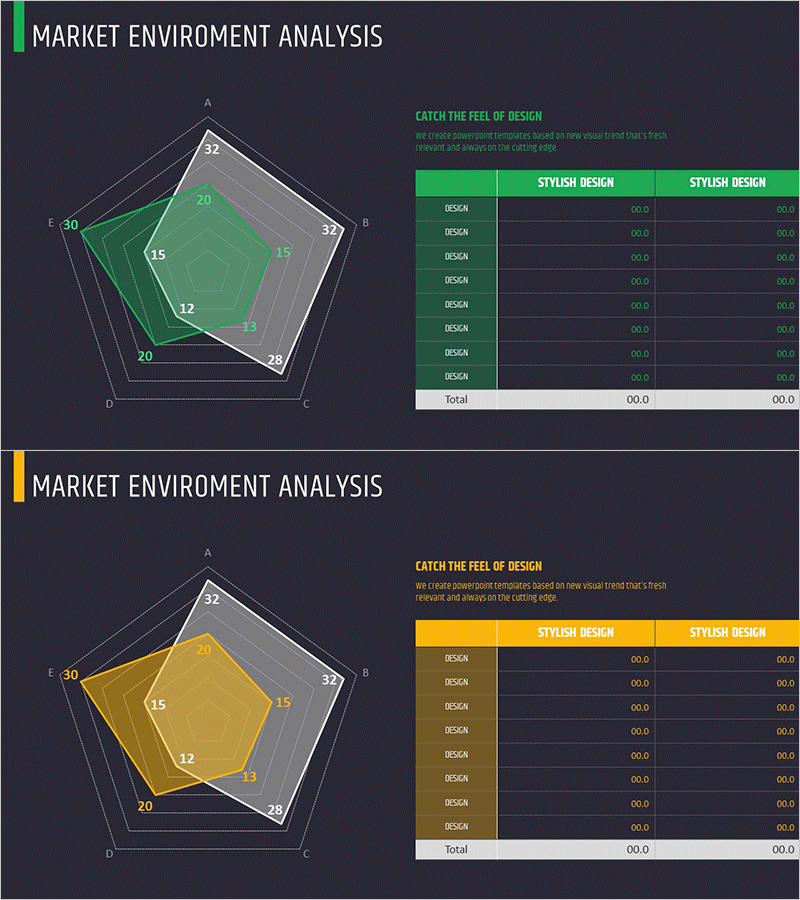
Business Status Analysis Graph & Table – Visualization of Market Analysis
#Market and Competitor Analysis #Diagram #Graph
-
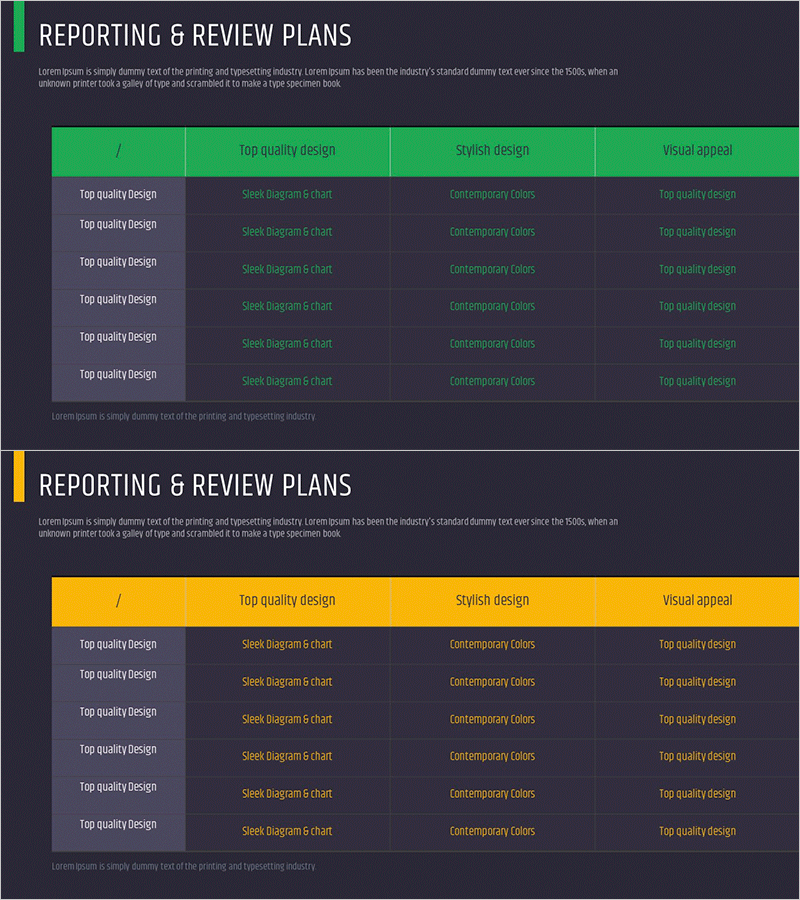
Report and Review Record Table – Efficient Business Management
#Business Management #Diagram #Execution Plan
-
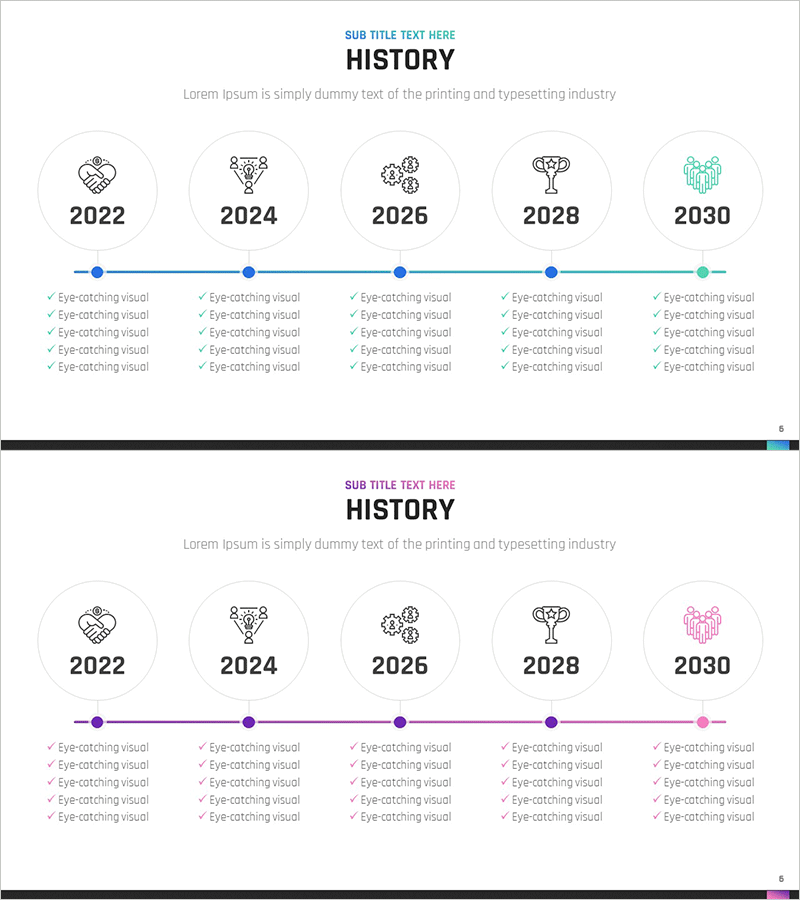
History Timeline Diagram – Effective Company Introduction
#Company Introduction #Diagram #History
-
Overlapping Diagram and Target Market Location – Visualizing Marketing Strategy
#Marketing Plan and Strategy #Diagram #Other
