Product/Service
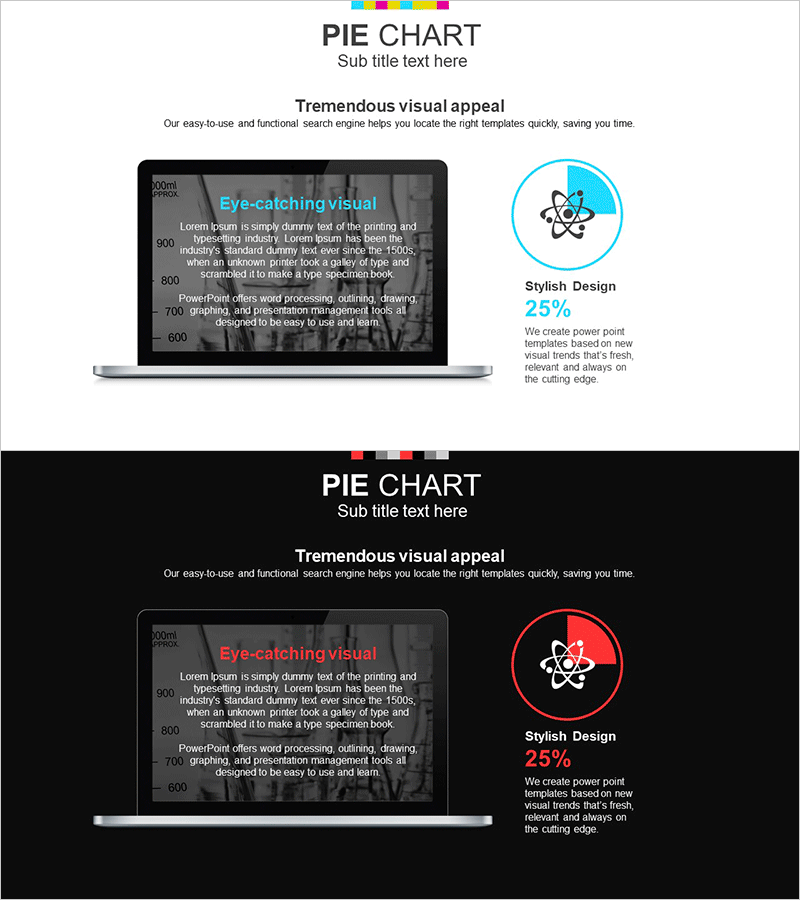
Chemical Experiment Analysis Circle Graph – Effective Data Visualization
RJ0700008_16
- Last Update 12/21/2025
- File Size 1.9MB
- # of Slides 2
- File Format PPTX
- Slide Ratio 16:9
- Color
Keywords
About the Product
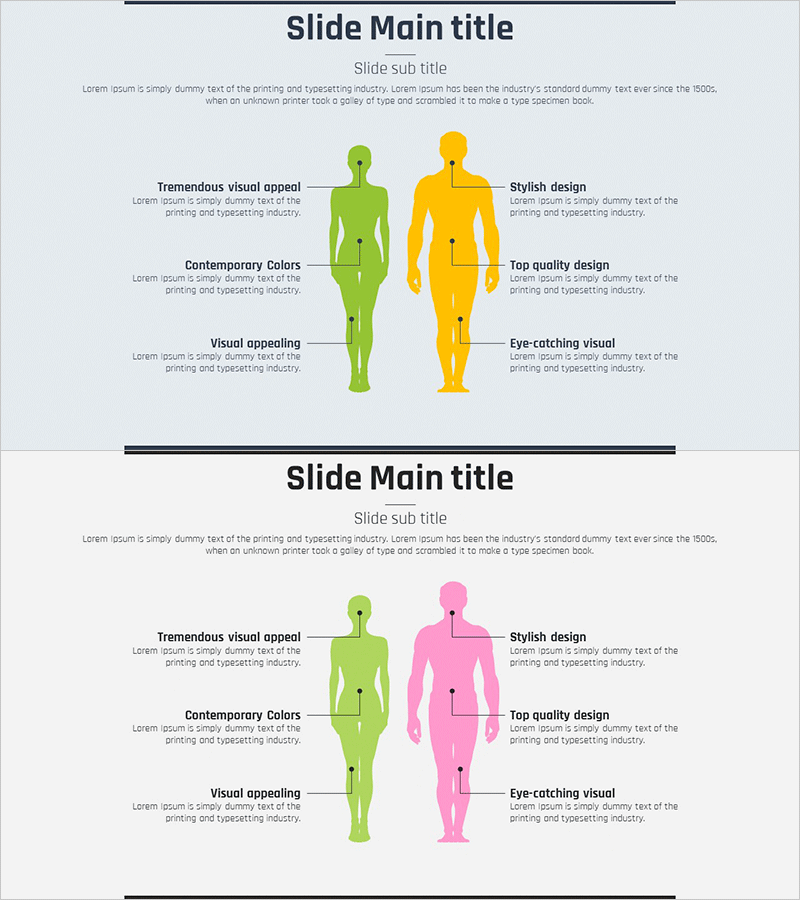
This slide is a circle graph designed to present chemical experiment data concisely and intuitively. Featuring two color schemes (white and black), it stands out with a luxurious design that is perfect for conveying research results or data. Users can easily replace data components for quick application in presentations. The editing difficulty is rated as 'easy', making it a practical format for immediate use.
Related Products
-
Sales Graphs and Strategies – Effective Decision Making through Data Visualization
#Graph
-
Key Components and Functional Roles – Effective Cluster Diagram
#Product/Service #Diagram #Features
-
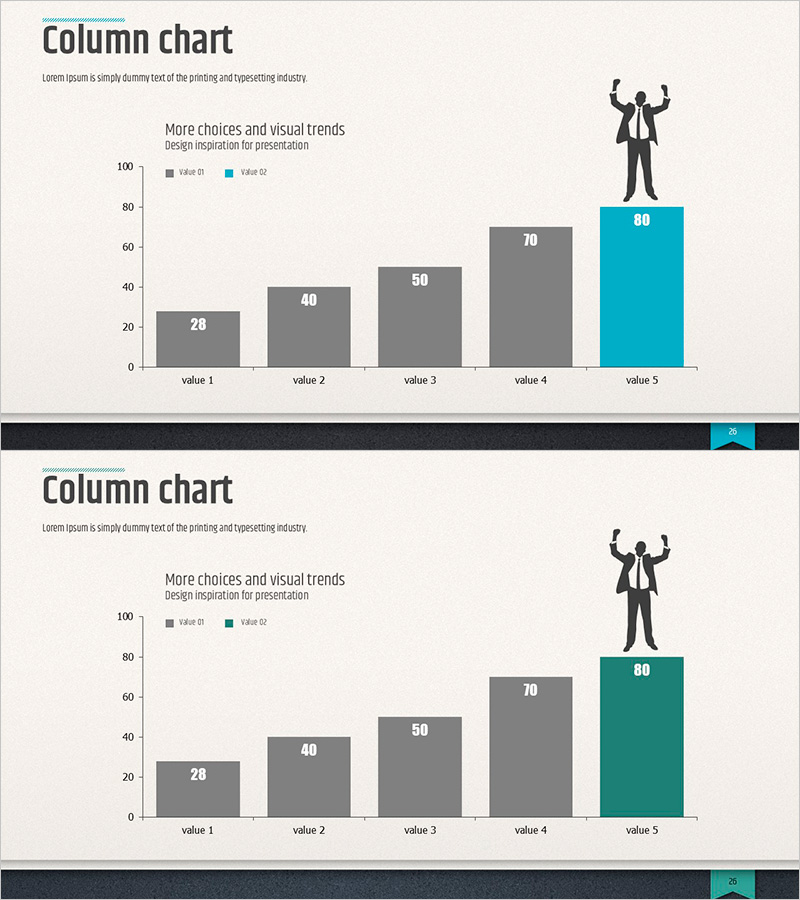
Column Chart for Market and Competitor Analysis – Modern Business Strategy
#Business Promotion Strategy #Market and Competitor Analysis #Graph
-
Gender Customer Analysis Silhouette Diagram – Insights to Enhance Customer Understanding
#Market and Competitor Analysis #Other #Customer Analysis
