Technology Sector
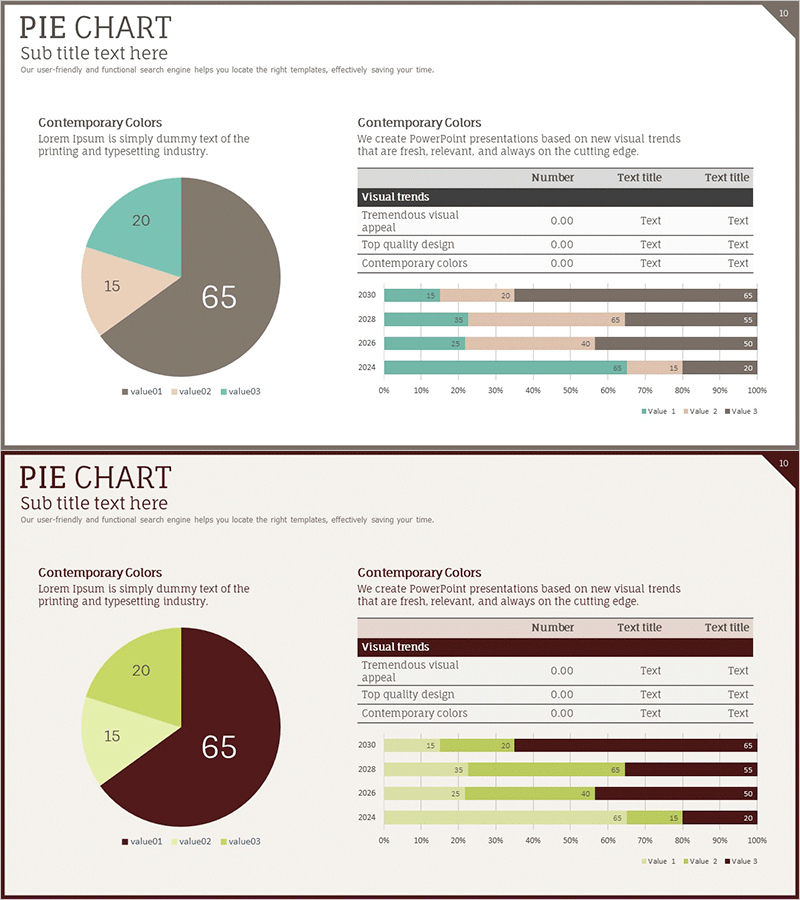
Graph Charts for Systematic Market Analysis – Bar and Pie Charts
RJ0700005_9
- Last Update 12/21/2025
- File Size 0.3MB
- # of Slides 2
- File Format PPTX
- Slide Ratio 16:9
- Color
Keywords
- #Content-Based Slides
- #Design-Based Slides
- #Technology Sector
- #Market and Competitor Analysis
- #Diagram
- #Graph
- #Research and Development
- #Market Analysis
- #Table
- #Horizontal Bar
- #Circles
- #Standard Table
- #Segmented Horizontal Bar
- #Pie Chart
- #16:9
- #Market Analysis
- #Graph
- #Chart
- #Segmented
- #Bar Chart
- #Pie Chart
About the Product
This slide template effectively showcases graph charts for systematic market analysis. Utilizing bar graphs and pie charts, it intuitively represents market conditions using various data visualization tools. The calming brown and green color combination instills trust, and the layout distinctly separates title and data areas for easy information delivery. Optimized for technology and competitive analysis materials, it conveys the emotional message of 'analysis' to support data-driven decision-making. The interchangeable elements include text and images, with a moderate editing difficulty level.
Related Products
-
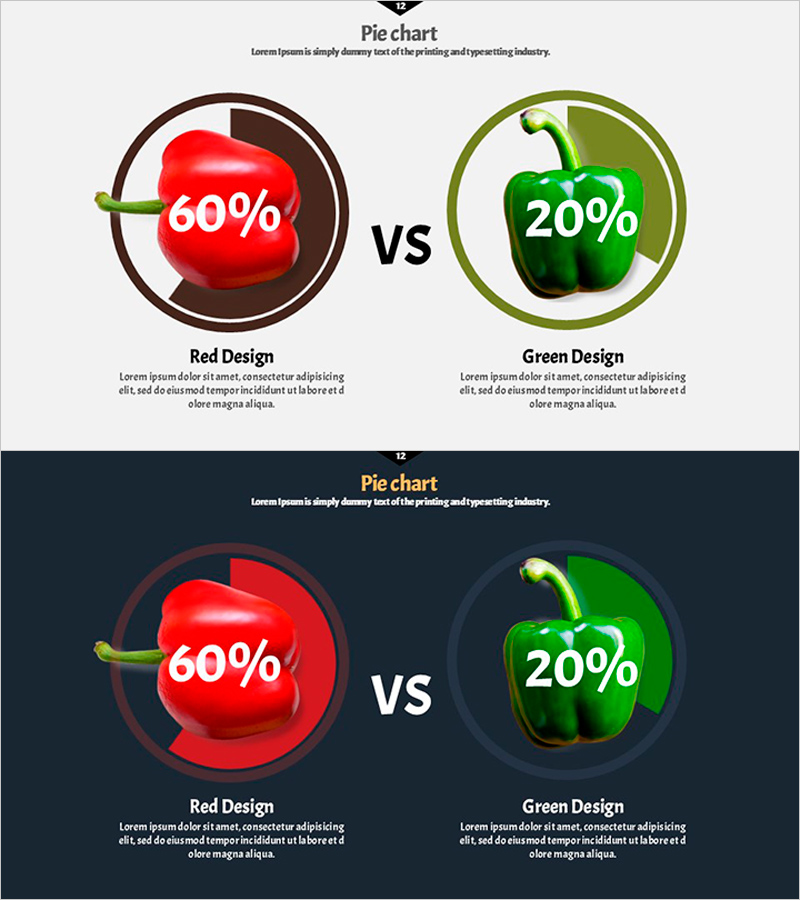
Vegetable Competition Pie Chart – Market Share Analysis
#Market and Competitor Analysis #Graph #Market Share
-
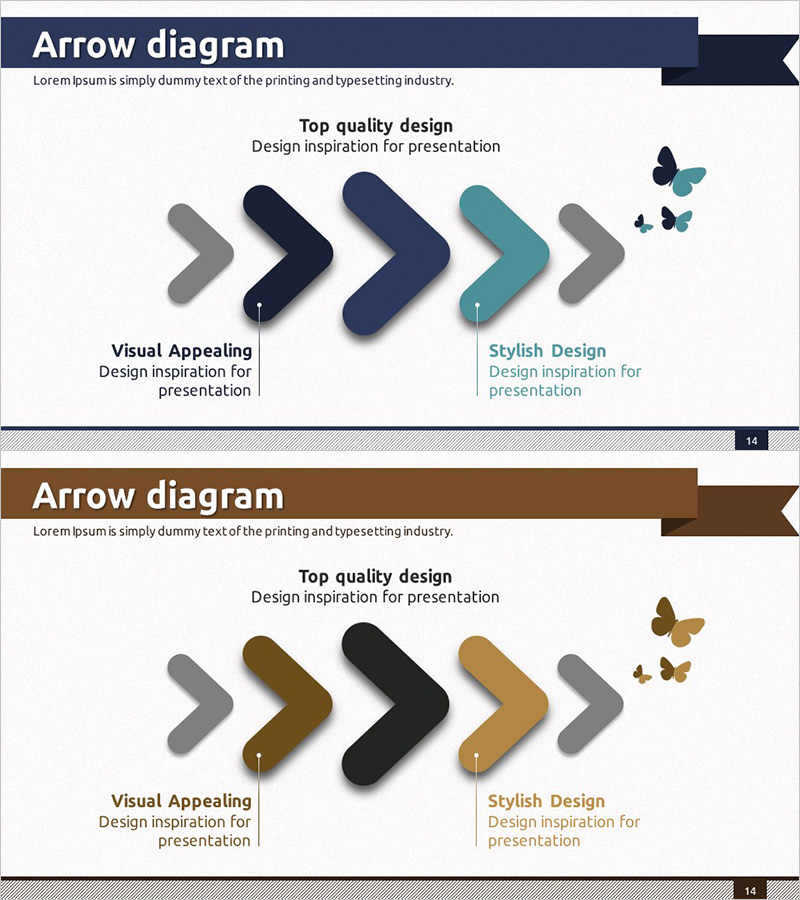
Environmental Protection Arrow Slide – Clearly Define Business Direction
#Business Promotion Strategy #Diagram #Business Direction
-
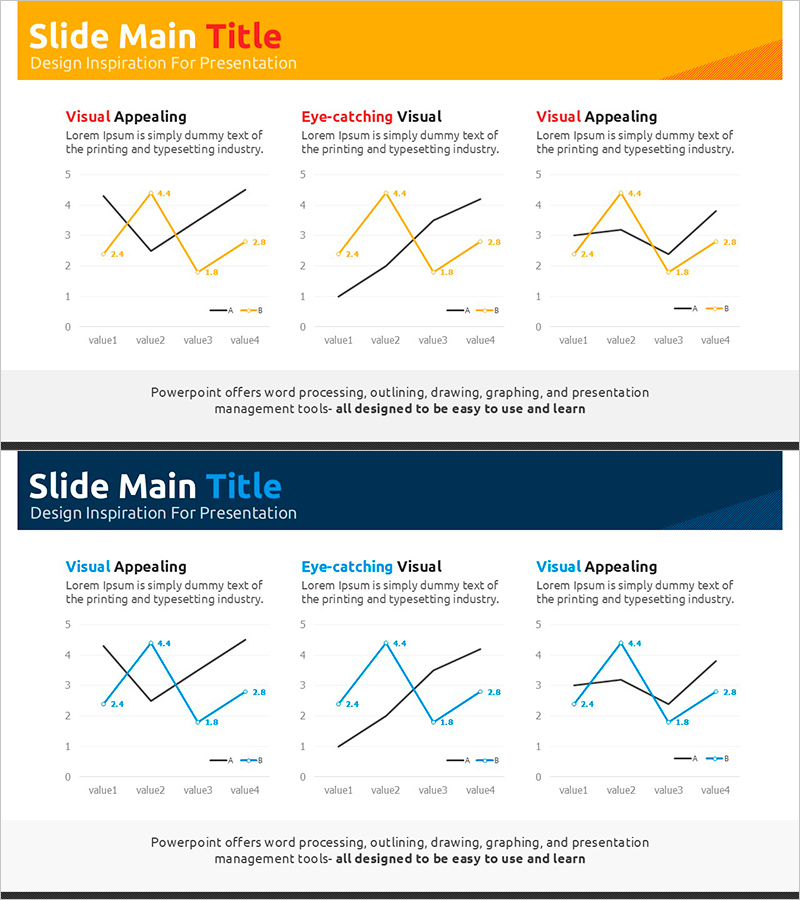
Yellow Blue Line Chart – Market Status and Revenue Analysis
#Market and Competitor Analysis #Financial Plans and Performance #Graph
-
Premium Diffusion Closed Diagram – Business Strategy and Vision
#Business Vision and Strategy #Diagram #Business Strategy
