
Product/Service
Blue Pink Circle Graph & Table Chart – Slide Highlighting Visual Appeal
RJ0700004_14
- Last Update 12/21/2025
- File Size 1MB
- # of Slides 2
- File Format PPTX
- Slide Ratio 16:9
- Color
Keywords
- #Content-Based Slides
- #Design-Based Slides
- #Product/Service
- #Operation Plan
- #Technology Sector
- #Diagram
- #Graph
- #Development Status
- #Research and Development
- #Table
- #Circles
- #Standard Table
- #Doughnut Chart
- #16:9
- #Blue Pink Circle Graph
- #Table Chart
- #Product Introduction
- #Operational Plan
- #Technology Sector
About the Product
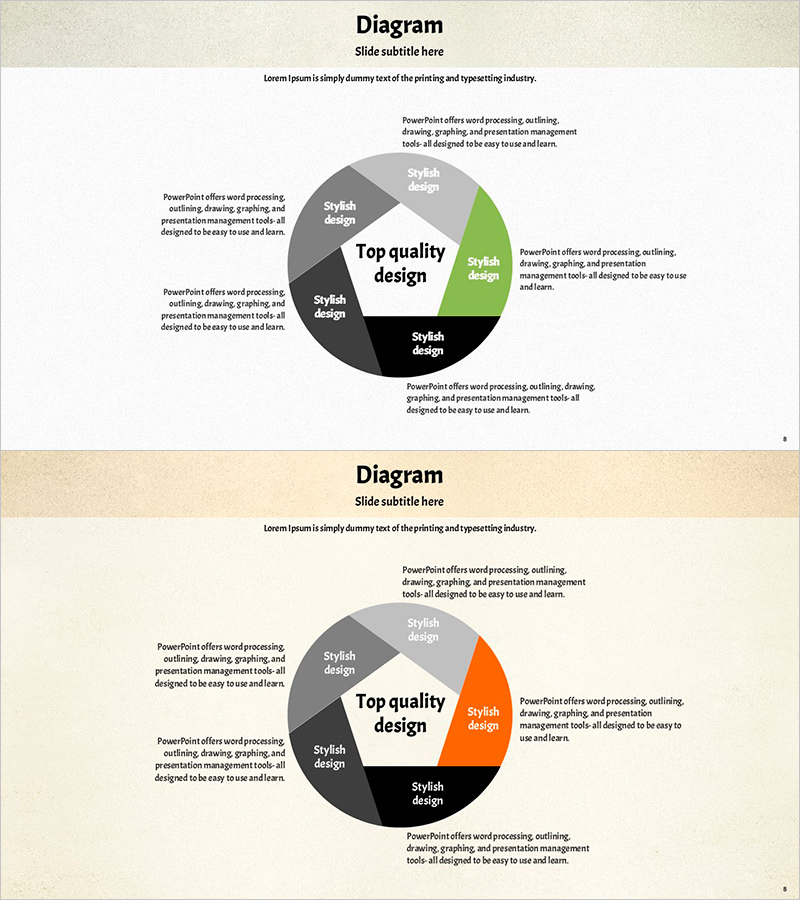
This slide utilizes blue pink circle graphs and table charts to intuitively convey information. The design features a gray background with contrasting colors that maximize visual appeal, making it ideal for introducing products and services or explaining operational plans, as well as showcasing developments in the technology sector. The slide arranges various data and infographics in a user-friendly manner, helping to enhance audience understanding and focus. Editing difficulty is rated as 'easy', allowing for simple text and data replacements.
Related Products
-
Green Orange Highlight Connection Diagram
#Business Promotion Strategy #Diagram # Product Production Plan
-
Business Expansion Strategy Flowchart for Clear Direction
#Business Introduction #Technology Sector #Diagram
-
About Us Blue Yellow Slide – Emotional Business Introduction
#Product/Service #Business Management #Product/Service Introduction
-
Social Media Linear Diagram – Stages of Business Growth
#Company Introduction #Business Promotion Strategy #Diagram
