Operation Plan
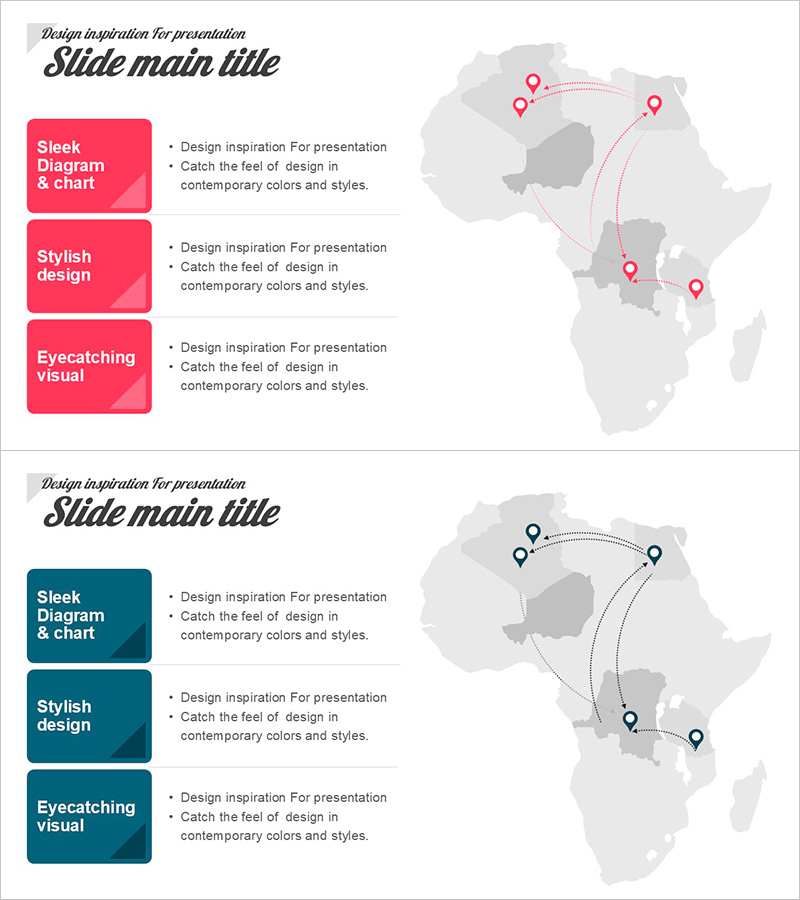
Visual Presentation Using Maps – Comprehensive Data Visualization
RJ0600098_26
- Last Update 12/21/2025
- File Size 0.2MB
- # of Slides 2
- File Format PPTX
- Slide Ratio 16:9
- Color
Keywords
About the Product
This slide features a visual presentation leveraging maps to clearly illustrate the relationships between multiple locations. With a modern and sleek design, it harmoniously connects data and visual elements to elevate the presentation's quality. The color contrast is striking, and the layout is organized to facilitate effective communication. Particularly suitable for business meetings, seminars, or presentations on cross-border marketing strategies, it can convey a strong message. Content modification and editing are easy, allowing for efficient practical usage.
Related Products
-
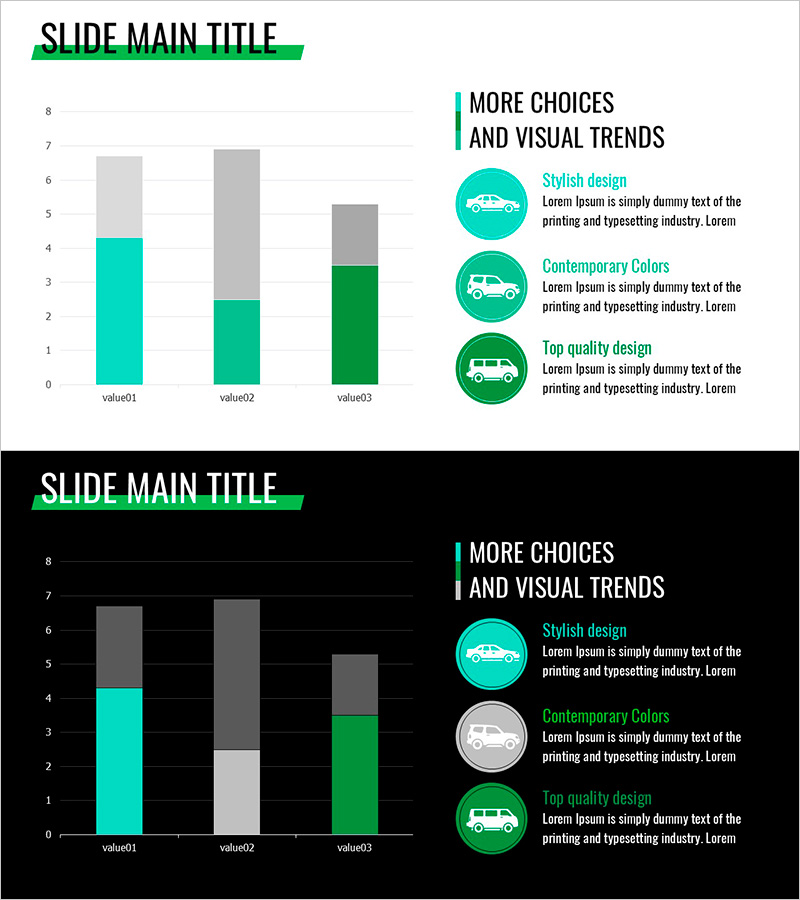
Segmented Vertical Bar Chart Template for Analyzing Car Sales
#Market and Competitor Analysis #Marketing Plan and Strategy #Graph
-

Key Messages from the CEO – Executive Vision and Goals
#Company Introduction #Text Box #Company Overview
-

Core KPIs for Enhancing Presentation Performance – Measuring Work Outcomes
#Business Promotion Strategy #Diagram #Graph
-
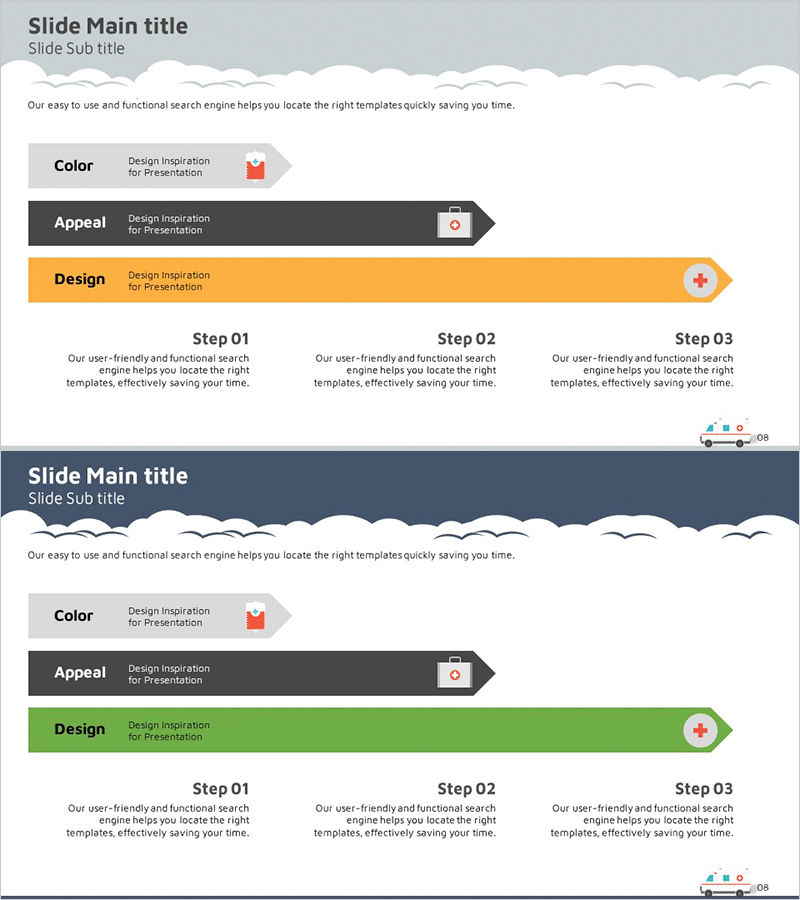
Marketing Goals Flow Diagram – Efficient Strategy Development
#Marketing Plan and Strategy #Diagram #Marketing Objectives
