Emotional Messages
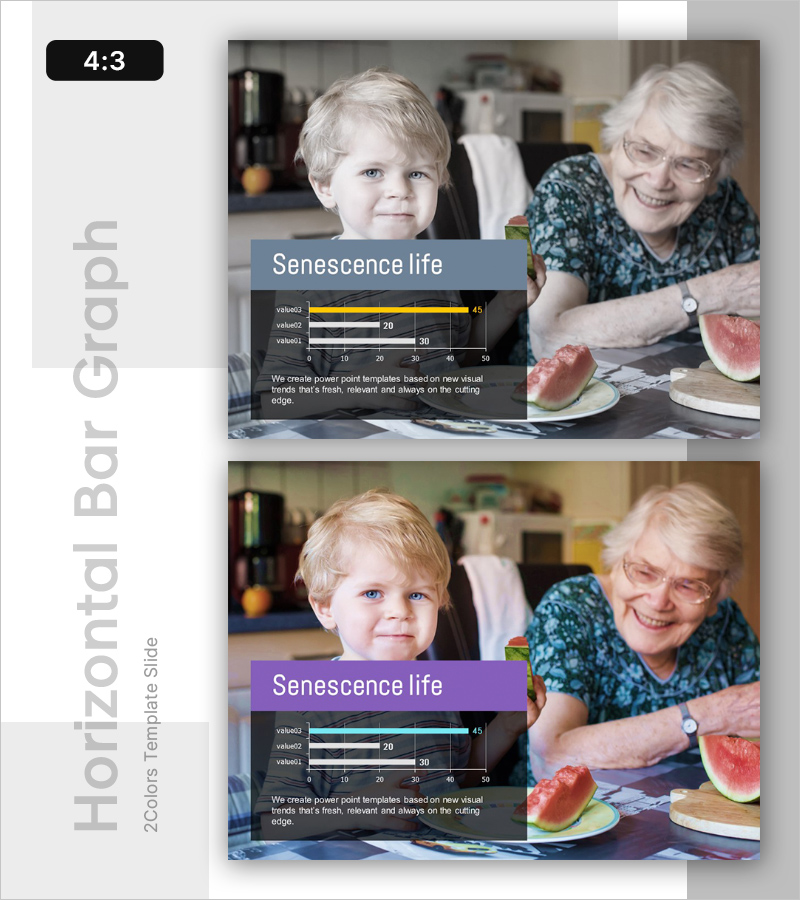
Aging Data Status Graph – Insightful Presentation
RL0100035_3
- Last Update 12/21/2025
- File Size 5.4MB
- # of Slides 2
- File Format PPTX
- Slide Ratio 4:3
- Color
Keywords
About the Product
This slide utilizes a bar chart to visually present data related to aging. The warm imagery of a child and an elderly person evokes a comforting feeling, while the blue and purple tones convey stability and trust. This slide is ideal for presenting results analysis, customer insights, or market trends. The text and graph layout allows for easy modifications, rated as 'easy' in editing difficulty, making it suitable for various presentations.
Related Products
-
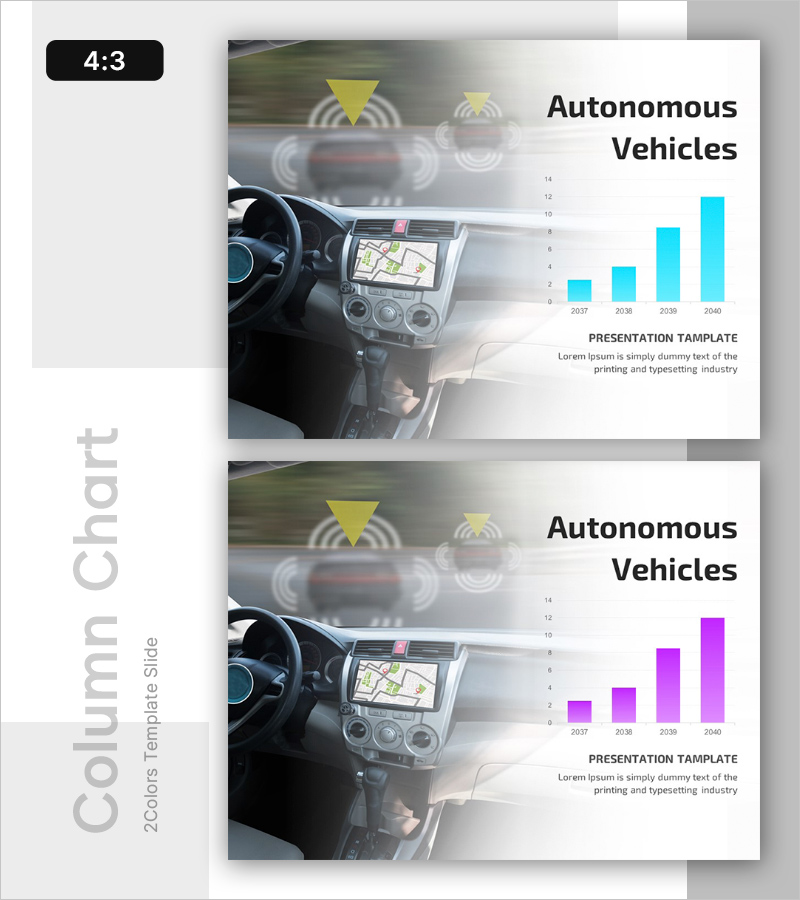
Autonomous Vehicles Status Graph – Essential Tool for Market Analysis
#Emotional Messages
-
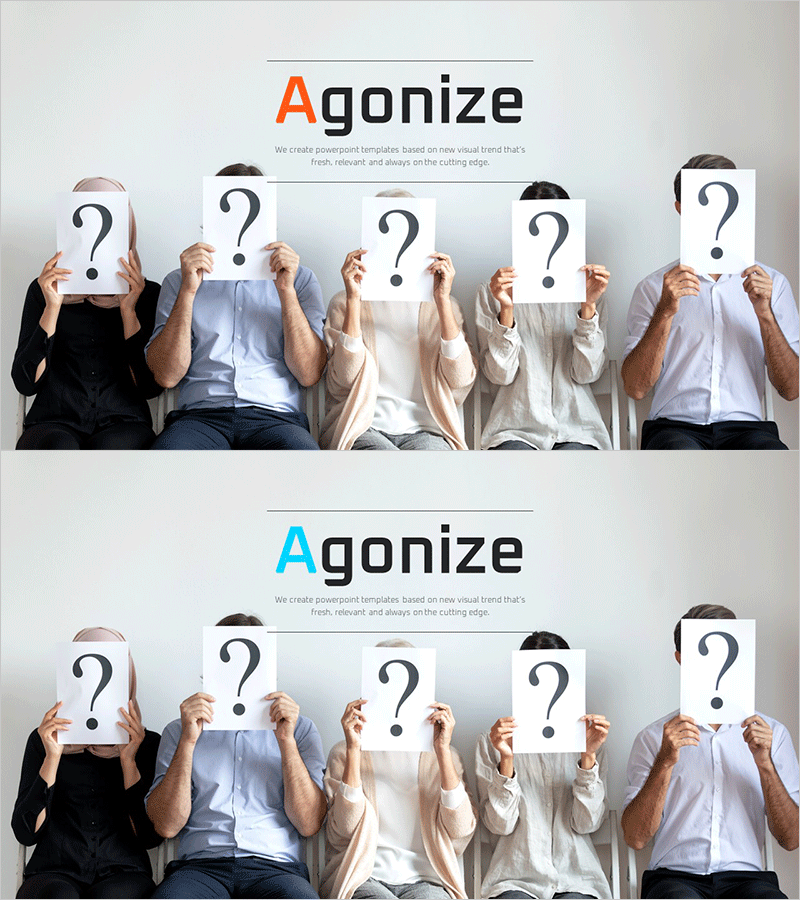
Creative Idea Generation Template Intro
#Emotional Messages
-
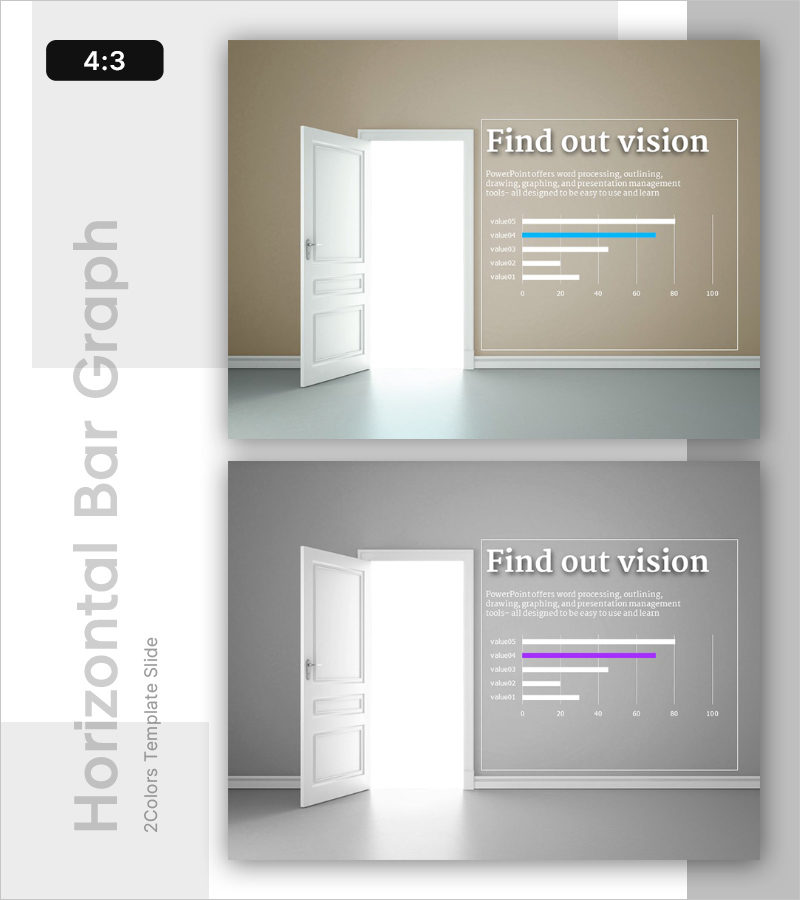
Positive Vision Analysis Graph - Optimized for Market and Competitor Analysis
#Emotional Messages
-
Content-Based Slide Template - Emphasis on Professionalism and Practicality
#Emotional Messages
