Positive Vision Analysis Graph - Optimized for Market and Competitor Analysis
RL0100061_3
- Last Update 01/21/2025
- File Size 1MB
- # of Slides 2
- File Format PPTX
- Slide Ratio 4:3
- Color
Keywords
About the Product
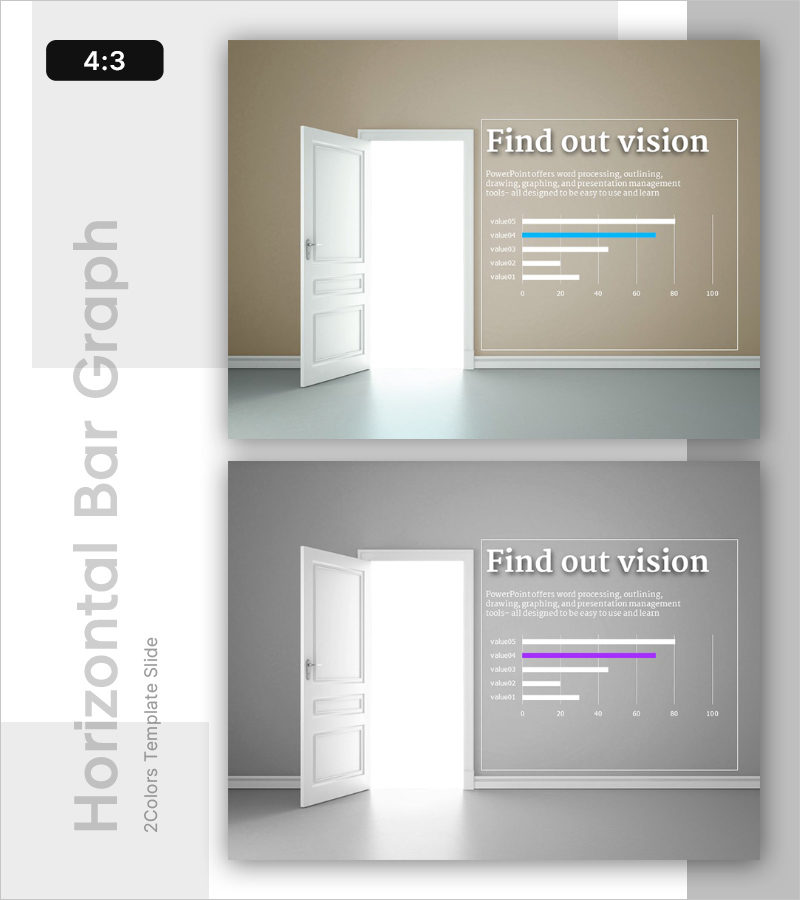
This slide effectively represents a positive vision analysis graph, featuring a harmonious blend of blue, purple, and gray colors. Its customizable and intuitive structure supports effective data comparison, making it ideal for market and competitor analysis presentations. The graph conveys information simply and clearly while providing a visually appealing element suitable for a stable business environment. This is a resource readily usable by practitioners and corporate teams, with replaceable elements included, and editing difficulty rated as 'easy'.
Usage Points
-
Main Usage
- This template is particularly useful for presenting market research findings, where clear visual representation of data is essential for stakeholder understanding and decision-making.
-
How to Use
- Users can employ this template during team meetings to dissect competitor performance or in client presentations to illustrate market trends, ensuring that complex data is communicated effectively.
-
Recommended For
- This resource is ideal for marketing professionals, analysts, and corporate strategists who need to deliver comprehensive data analyses in a straightforward and visually appealing format.
-
Slide Structure
- The overall flow of the slides includes an introduction to the market analysis, followed by detailed visual data comparisons, and concludes with actionable insights and recommendations based on the presented data.
Related Products
-

Potential Template Cover – A Professional and Emotional Start
#Emotional Messages
-

Opportunities for Advancement in Life – Vision and Strategy for Success
#Emotional Messages
-

Cluster Slide for Company Overview - See the Possibilities
#Emotional Messages
-

Future Vision Diagram – Visualizing Business Strategy and Vision
#Emotional Messages
