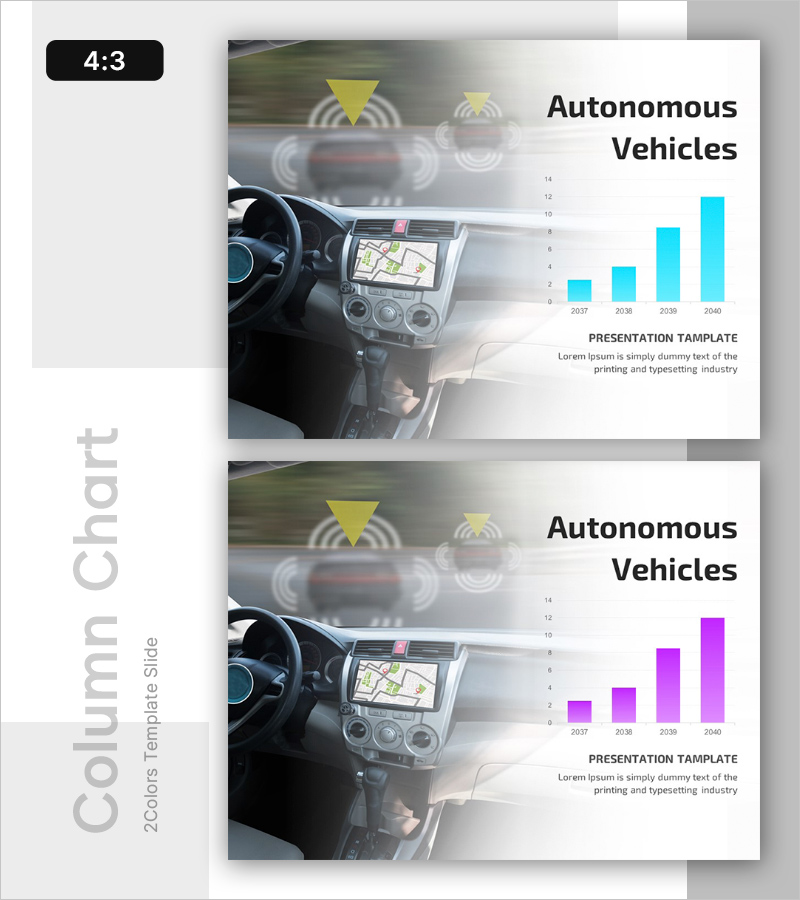
Autonomous Vehicles Status Graph – Essential Tool for Market Analysis
RL0100089_6
- Last Update 01/23/2025
- File Size 1.9MB
- # of Slides 2
- File Format PPTX
- Slide Ratio 4:3
- Color
Keywords
About the Product
A professional PowerPoint slide set visualizing the autonomous vehicles market growth trajectory from 2037 to 2040 using cyan bar charts. The slide features an automotive dashboard background with sensor icons, reinforcing technological credibility for investors, engineers, and executives. Designed in 4:3 ratio PPTX format for seamless integration into existing presentations. This data visualization slide is essential for market analysis reports, competitive landscape assessments, and technology trend presentations in the automotive and mobility sectors.
Usage Points
-
Main Usage
Quantitatively communicate autonomous vehicle market expansion to demonstrate the commercial value of technology innovation. The four-year growth curve (2037–2040) effectively highlights future market opportunities and investment rationale for stakeholders.
-
How to Use
Insert into investor relations materials, technology strategy presentations, or market analysis reports in the 'Market Overview' or 'Technology Trends' section. Edit the bar chart values with actual data to compare market share between your company and competitors.
-
Recommended For
Automotive technology managers, new business development teams, investor relations professionals, market research analysts, and technology innovation presenters who need to communicate market size and growth potential objectively.
-
Slide Structure
Title area (Autonomous Vehicles), background imagery (vehicle dashboard and sensor icons), four-stage bar chart (2037–2040), legend and numerical value display. Contains 2 text input areas with simple time-series comparison data hierarchy.
Related Products
-

Introduction to 3D Printing Business – Growth Through Innovation
#Emotional Messages
-

Decentralization Individual Empowerment
#Emotional Messages
-

Internet Connected Clothes Service Overview – Innovative Technology and Future Vision
#Emotional Messages
-

Big Data Technology Business Goals – Cluster Diagram
#Emotional Messages
