Business Promotion Strategy
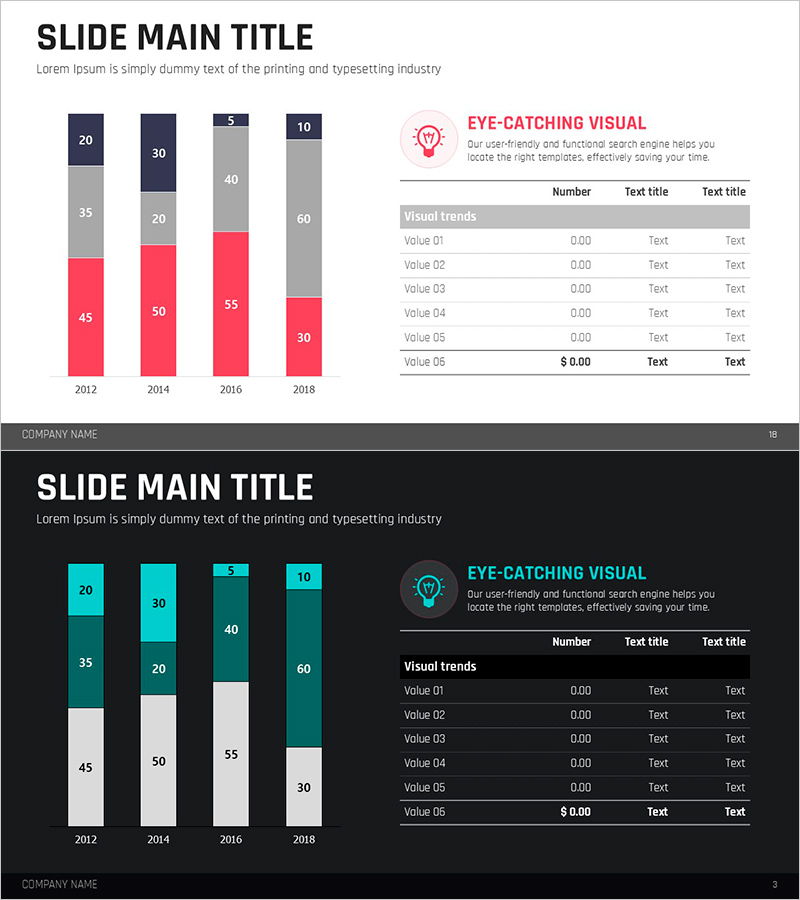
Red Green Market Analysis Slide – Effective Data Visualization
RJ0600082_17
- Last Update 12/21/2025
- File Size 0.2MB
- # of Slides 2
- File Format PPTX
- Slide Ratio 16:9
- Color
Keywords
- #Content-Based Slides
- #Design-Based Slides
- #Business Promotion Strategy
- #Market and Competitor Analysis
- #Diagram
- #Graph
- #Achievements
- #Industry Trends
- #Table
- #Column
- #Standard Table
- #Segmented Column
- #16:9
- #Market Analysis
- #Horizontal Bar Graph
- #Vertical Bar Graph
- #Performance
- #Data Visualization
- #Presentation Slide
- #Business Strategy
About the Product
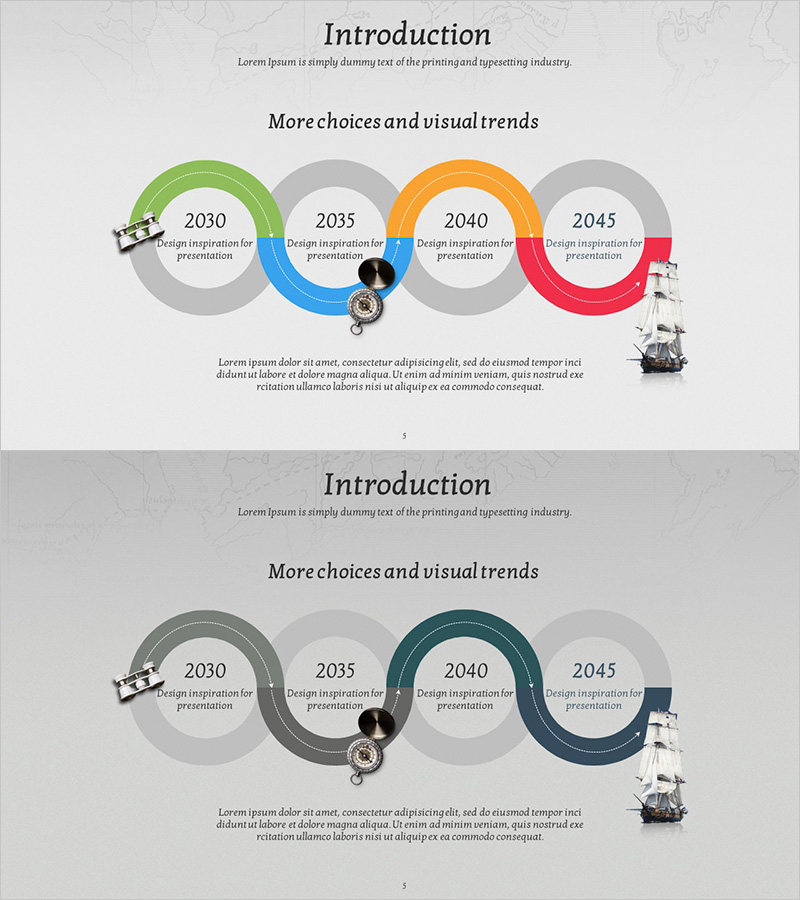
This presentation template aims to visually convey market analysis data using colors red and green. With diagrams and graph structures, one can easily review each year's performance and market trends. A large title summarizing the topic is positioned at the top, with details regarding the data organized below. Particularly suitable for public institutions or corporations’ market strategy presentations, it effectively delivers data-driven recommendations. The template allows easy text and data replacement, rated as 'easy' in editing difficulty, enabling immediate use in various presentation scenarios.
Related Products
-
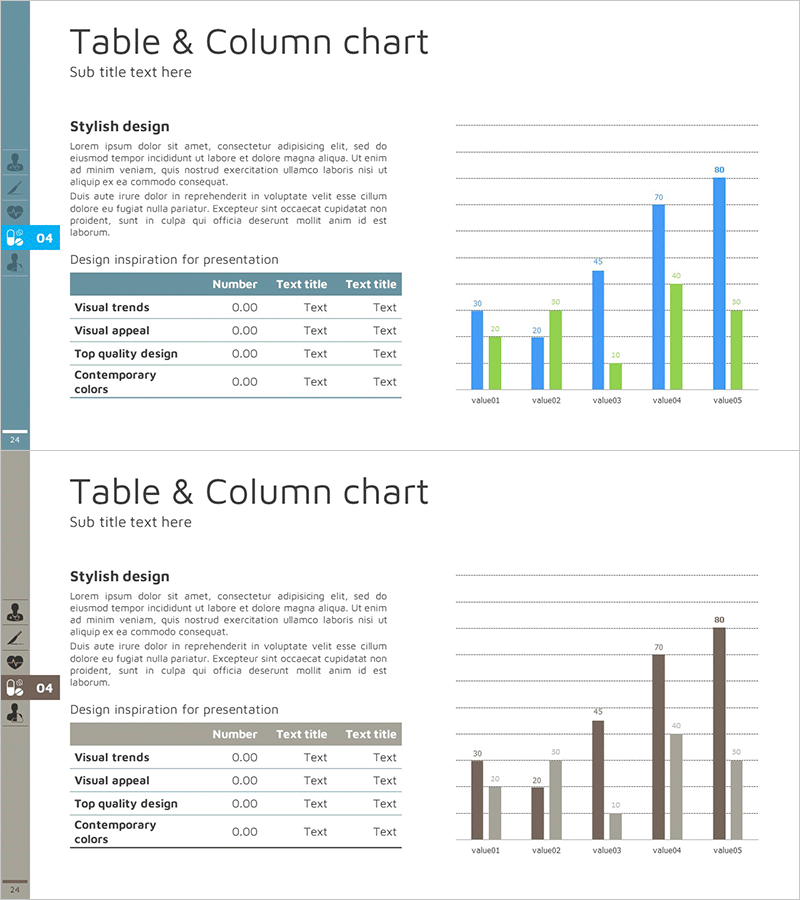
Table Chart & Clustered Column Graph – Market and Competitor Analysis
#Market and Competitor Analysis #Diagram #Graph
-
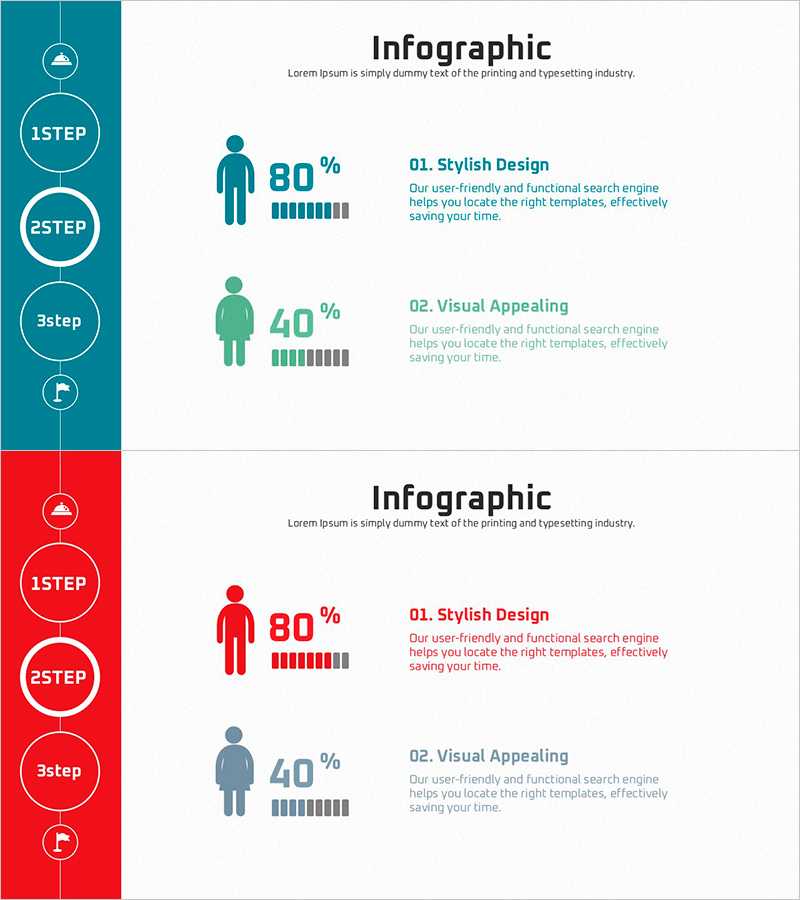
Male and Female Analysis Results – Providing Differentiated Insights
#Market and Competitor Analysis #Graph #Other
-
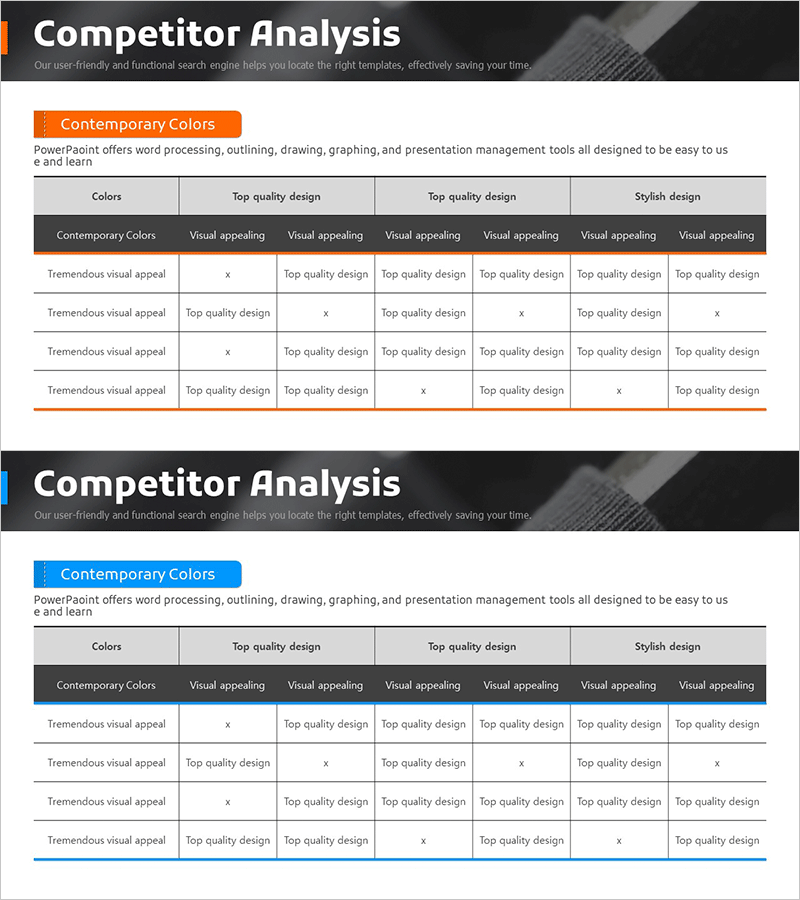
Competitor Comparison Analysis Chart – Finding Market Leaders
#Market and Competitor Analysis #Diagram #Competitor Analysis
-
Adventure Company History 4 Color Connection Diagram
#Company Introduction #Business Promotion Strategy #Diagram
