Company Introduction
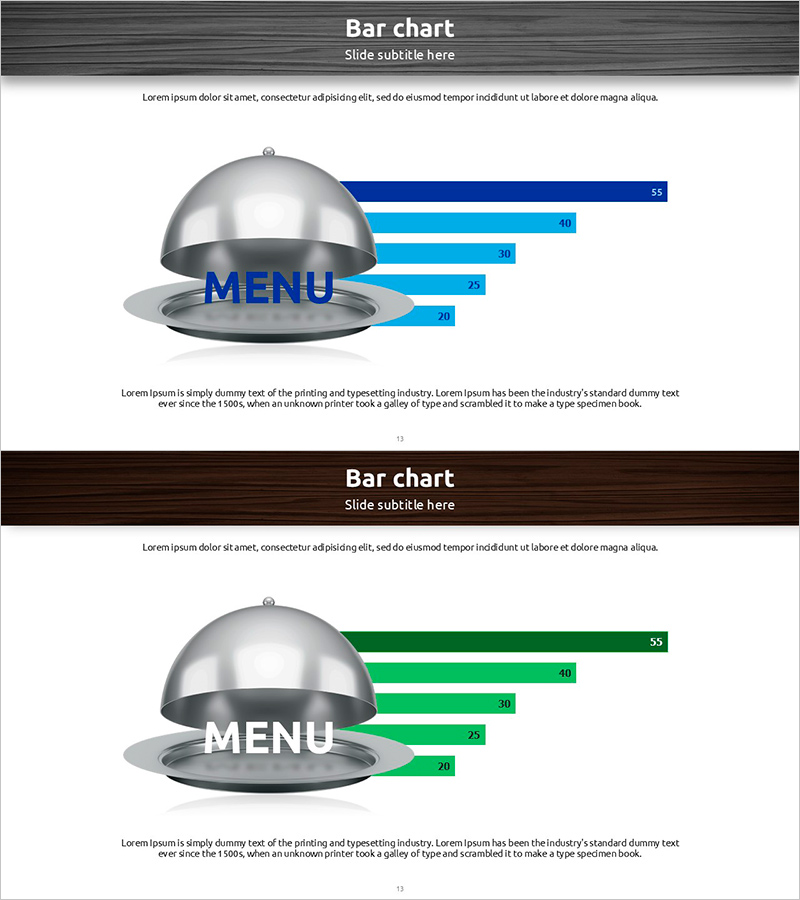
Preferred Menu Survey Visualization with Horizontal Bar Chart
RJ0600077_12
- Last Update 12/21/2025
- File Size 6.7MB
- # of Slides 2
- File Format PPTX
- Slide Ratio 16:9
- Color
Keywords
About the Product
This slide utilizes a horizontal bar chart to visually present the results of a survey on preferred menu items. The design highlights data representation based on survey findings, making information intuitively understandable for the audience. With a harmonious blend of blue and green, it provides visual stability, ideal for various business presentations related to menu discussions. It is particularly effective for conveying business strategies and key achievements, making it suitable for executive reports and investment proposals. The editing structure is simple, allowing for easy replacement of elements (text and data), with an overall editing difficulty rated as 'easy' for immediate application by all users.
Related Products
-
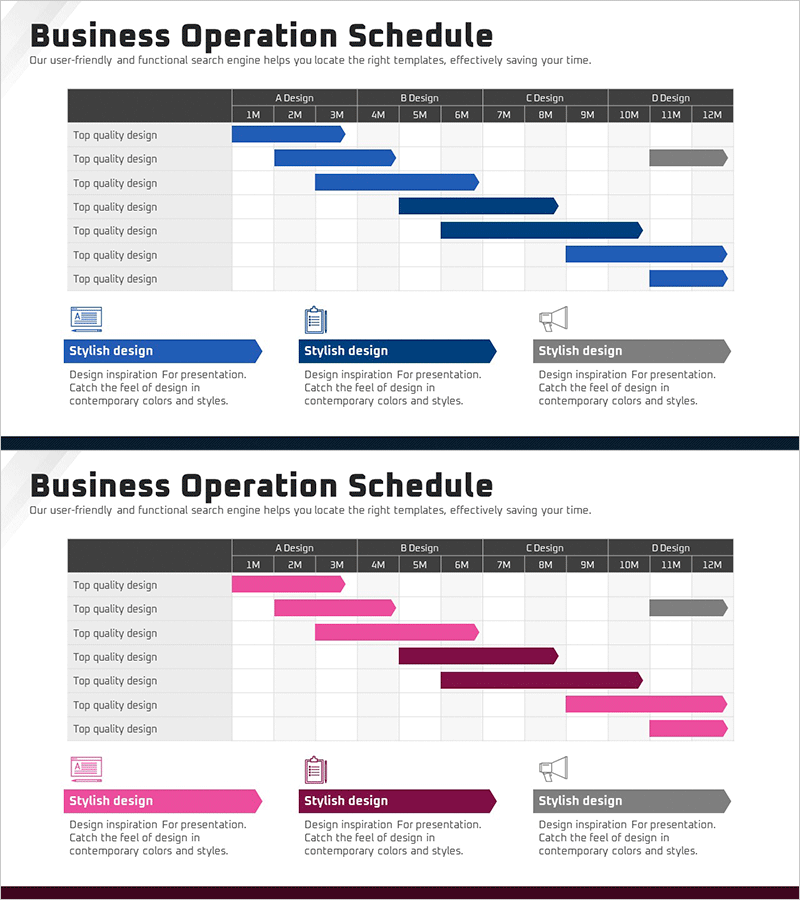
Operational Schedule Roadmap – Effective Business Promotion Strategy
#Business Promotion Strategy #Operation Plan #Diagram
-
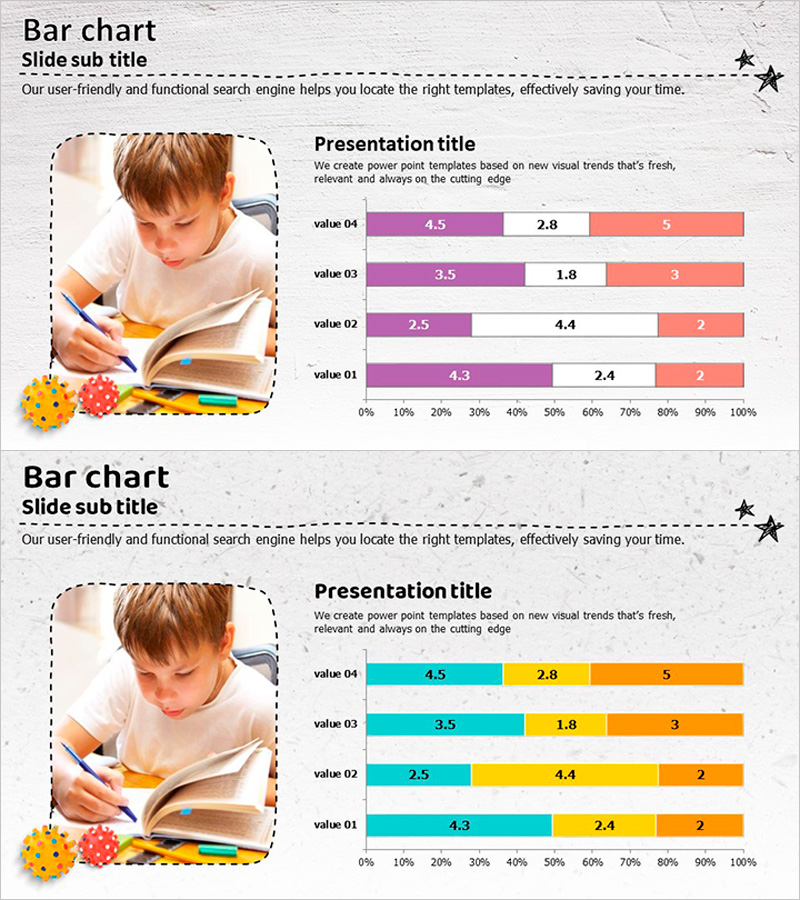
Study Image and Horizontal Segmentation Bar Graph - Customer Analysis and Market Trends
#Market and Competitor Analysis #Graph #Customer Analysis
-
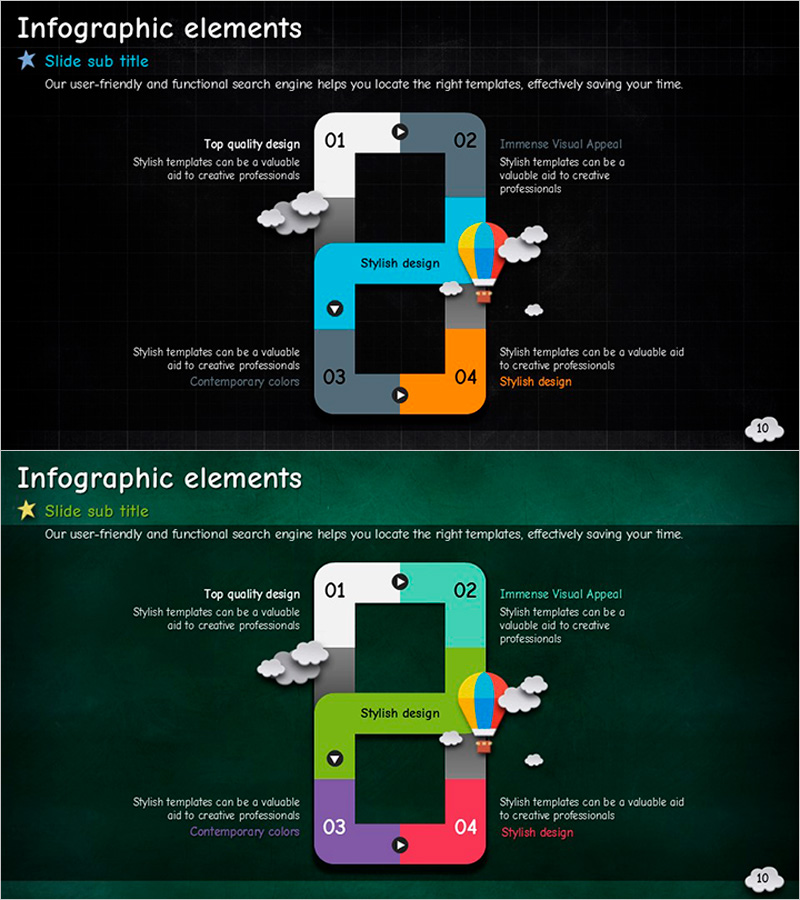
Square Connected Diagram - Optimal Choice for Strategic Business Advancement
#Business Promotion Strategy #Technology Sector #Diagram
-
Annual Implementation Plan Slide – Business Strategy and Vision
#Company Introduction #Business Promotion Strategy #History
