Business Promotion Strategy
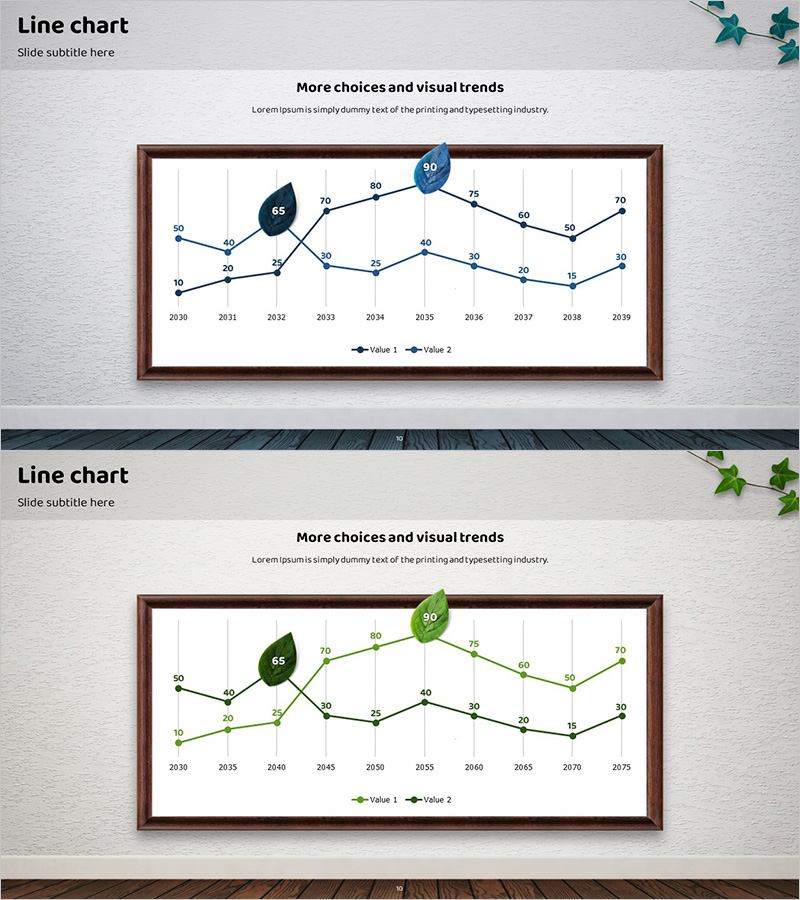
Eco-friendly Business Project Line Graph – Embracing Sustainability
RJ0600070_9
- Last Update 12/21/2025
- File Size 5.1MB
- # of Slides 2
- File Format PPTX
- Slide Ratio 16:9
- Color
Keywords
About the Product
This slide features a line graph illustrating the performance of an eco-friendly business project. The data points utilize leaf icons to convey a sustainable business message, embodying the sentiment of 'sustainability'. This graph is ideal for analyzing key market status and future projections. The blue and green color combination provides a sense of vitality and trust, with a clear layout designed for sharp data visualization. Users can integrate this easily into various business presentation materials, and the text and data sections are easily replaceable, rated with an editing difficulty of 'easy'.
Related Products
-
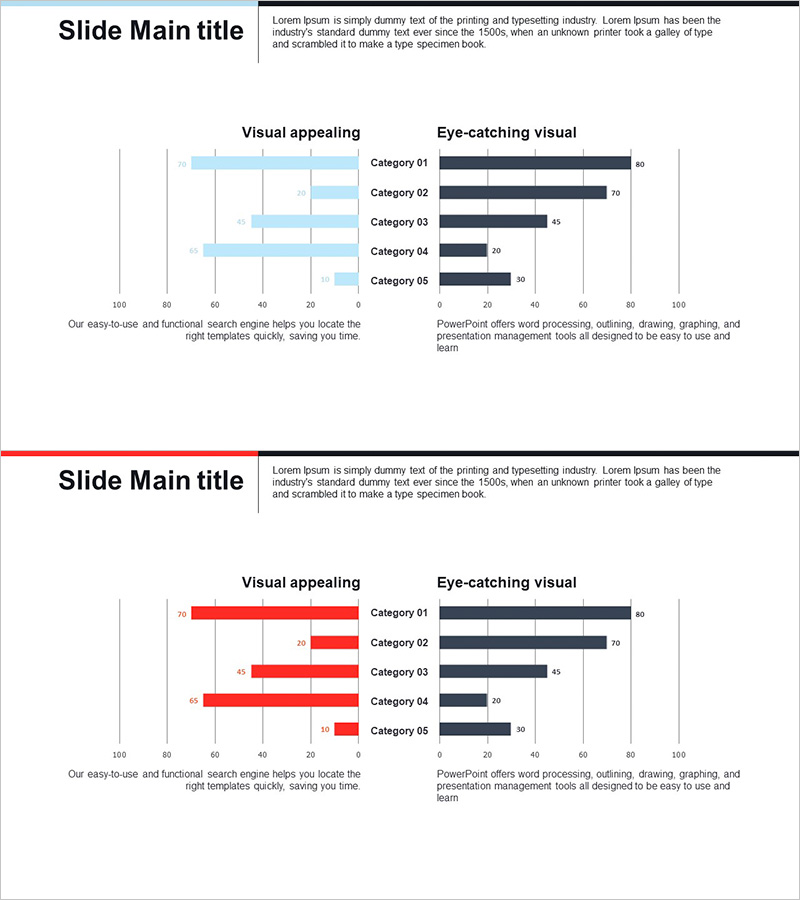
Competitor Analysis Bar Graph – Check Market Advantage
#Market and Competitor Analysis #Graph #Competitor Analysis
-
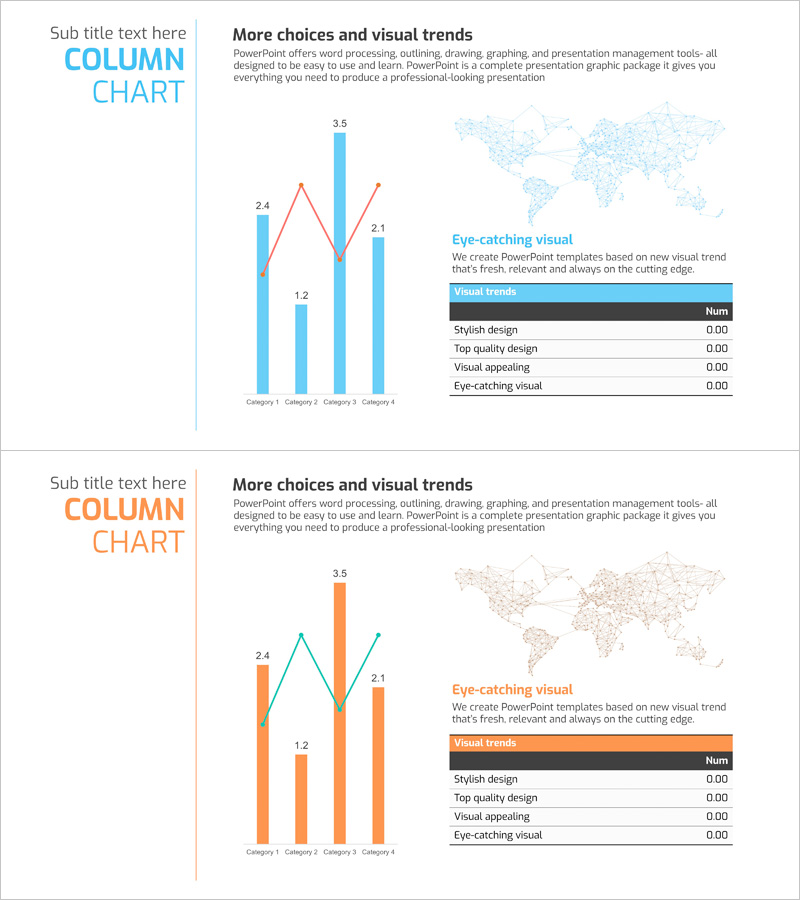
Global Target Market Analysis Graph
#Market and Competitor Analysis #Diagram #Graph
-
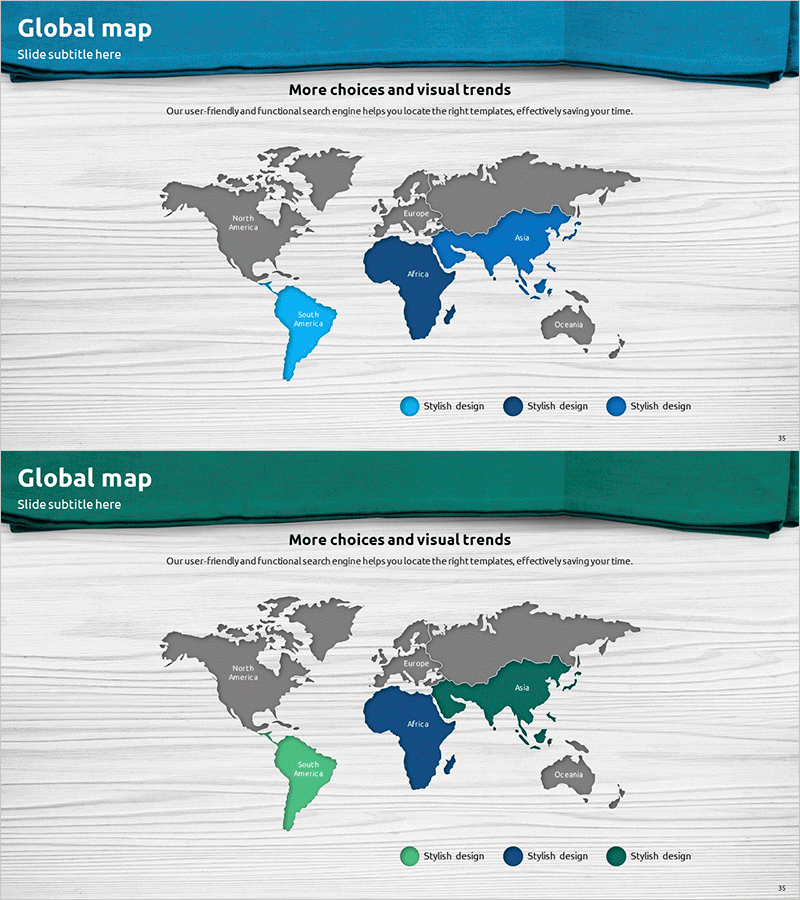
Global Target Market World Map – Strategic Focus on Target Markets
#Company Introduction #Market and Competitor Analysis #Other
-
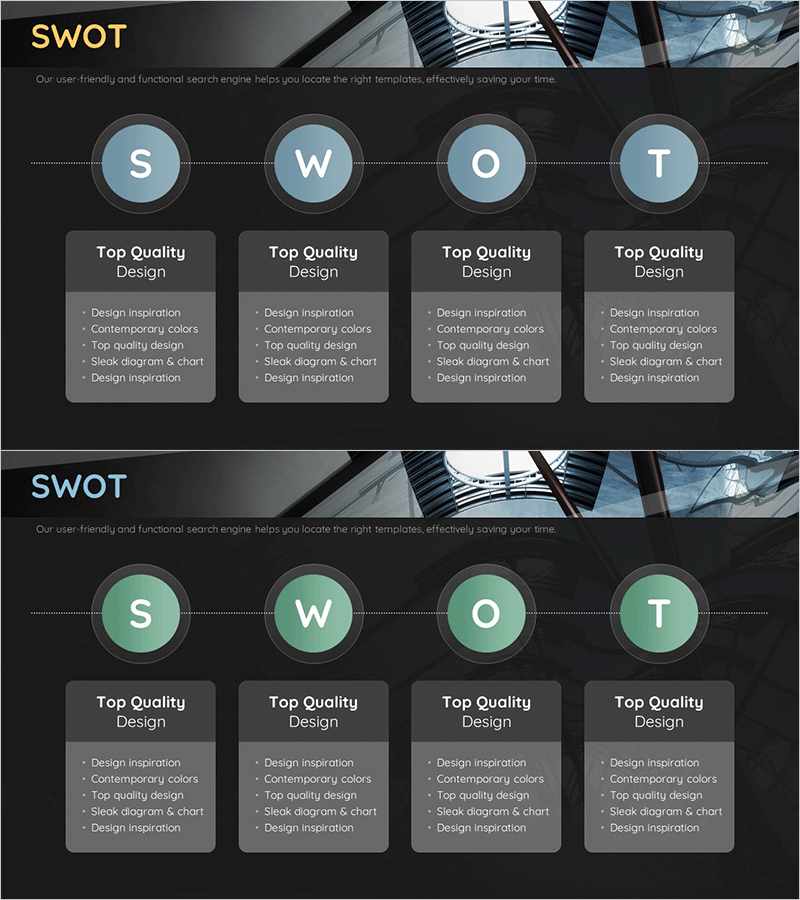
SWOT Analysis Connection Diagram – Optimized for Market Analysis
#Market and Competitor Analysis #Diagram #SWOT Analysis
