Company Introduction
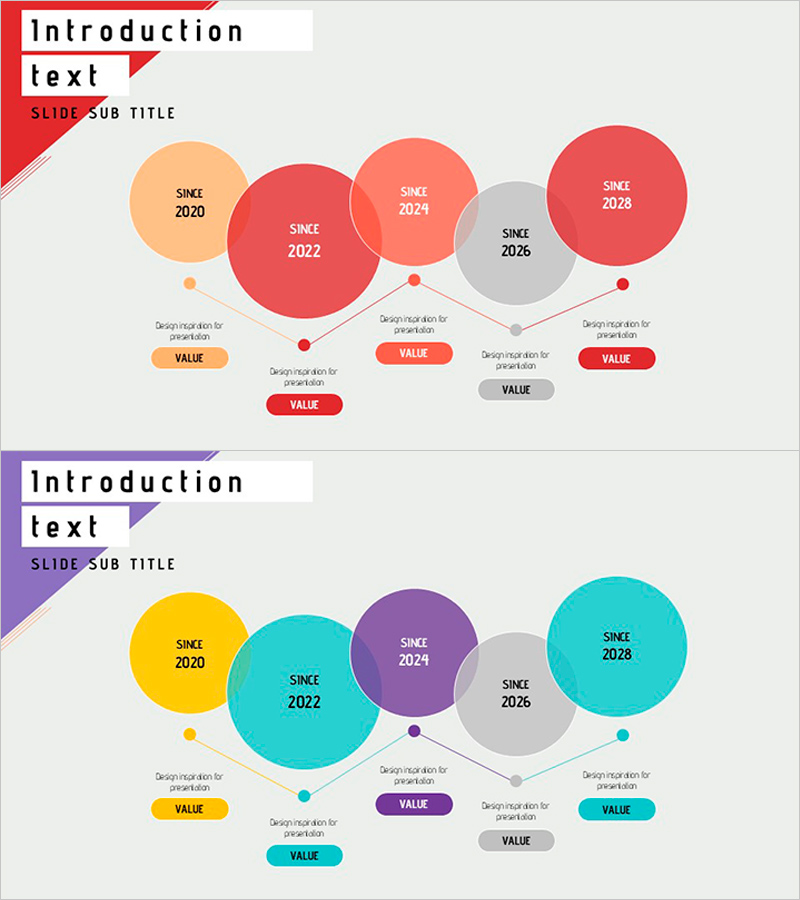
Historical History Diagram by Year – Business Strategy and Vision
RJ0600064_4
- Last Update 12/21/2025
- File Size 0.4MB
- # of Slides 2
- File Format PPTX
- Slide Ratio 16:9
- Color
Keywords
About the Product
This slide visually represents the historical milestones by year in a diagram format. With a simple and intuitive layout, it emphasizes significant milestones in each year using distinct colors, allowing for streamlined information delivery. The lively color combination of red, teal, and purple captivates the audience's attention. This slide effectively conveys the company's history, strategy development process, and implementation roadmap, leaving a strong impression, especially in business plans or investment proposals. Replaceable elements allow for easy input of year-related information, with average editing difficulty, making it suitable for various presentations.
Related Products
-
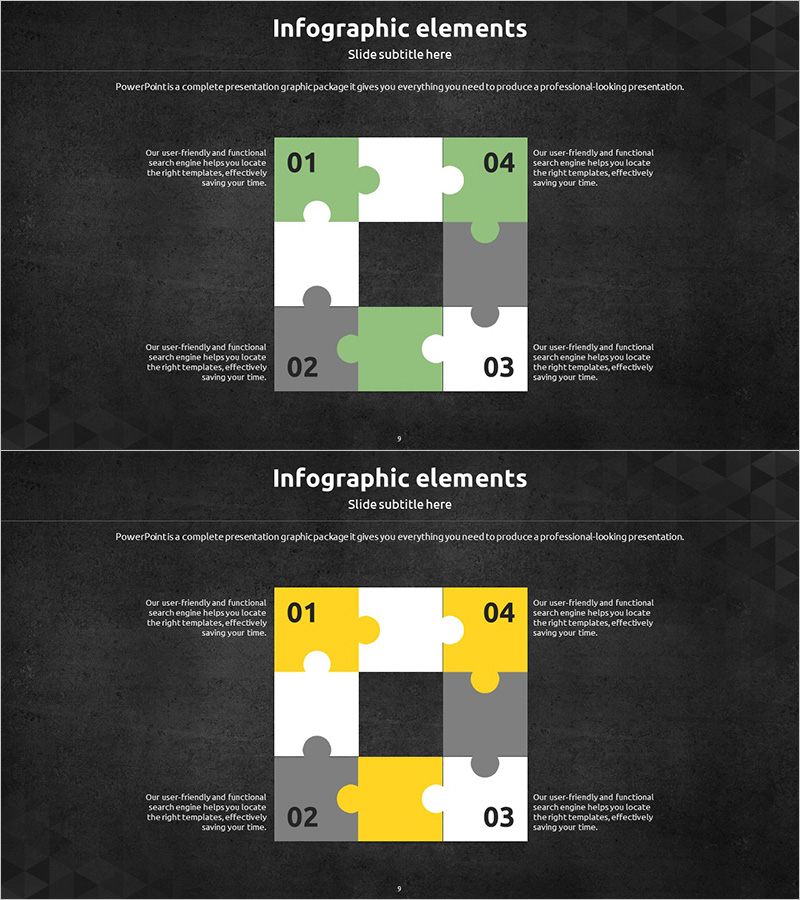
Business Process Puzzle Diagram – Implementing Strategic Vision
#Business Vision and Strategy #Operation Plan #Diagram
-

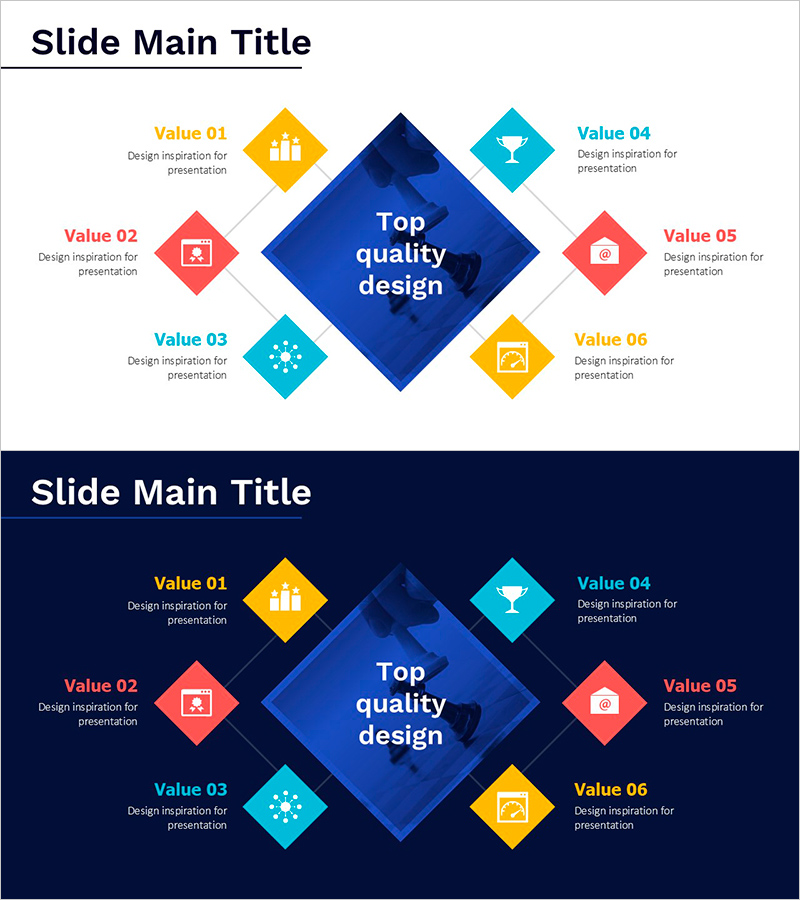
Visualizing Strategic Goals with Key Success Factors Connection Diagram
#Product/Service #Business Vision and Strategy #Diagram
-
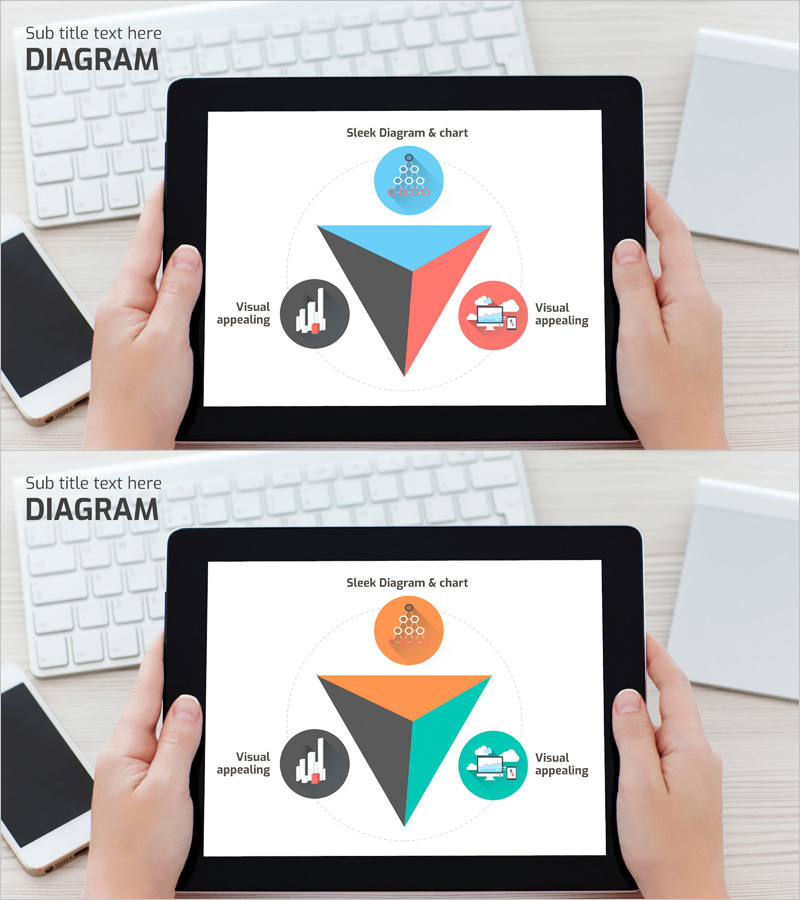
Big Data Domain Triangle Diagram
#Company Introduction #Business Introduction #Diagram
-
Game Strategy Visualization Diagram Slide – Emphasizing Core Competencies
#Business Vision and Strategy #Technology Sector #Diagram
