
Operation Plan
Magic Analysis Chart for Visualizing Operations and Marketing Goals
RJ0600042_17
- Last Update 12/21/2025
- File Size 1.9MB
- # of Slides 2
- File Format PPTX
- Slide Ratio 16:9
- Color
Keywords
- #Content-Based Slides
- #Design-Based Slides
- #Operation Plan
- #Marketing Plan and Strategy
- #Diagram
- #Graph
- #Production and Technological Development Strategy
- #Marketing Objectives
- #Flow
- #Column
- #Linear Flow
- #Column Chart
- #16:9
- #Magic Analysis Chart
- #Operations Plan
- #Marketing Strategy
- #Graphs
- #Statistical Visualization
About the Product
This PowerPoint slide utilizes a magic-themed analysis chart to visually emphasize operations planning and marketing goals. The harmonious colors of yellow and blue catch the eye, while the layout appropriately arranges text and images to aid clear data delivery. This slide is suitable for various business environments, especially effective during marketing strategy meetings or when presenting new ideas. Reusable elements include text, values, and colors, with an editing difficulty level rated as moderate.
Related Products
-

5-Step Linear Circle Diagram – Business Strategy
#Business Promotion Strategy #Business Management #Operation Plan
-
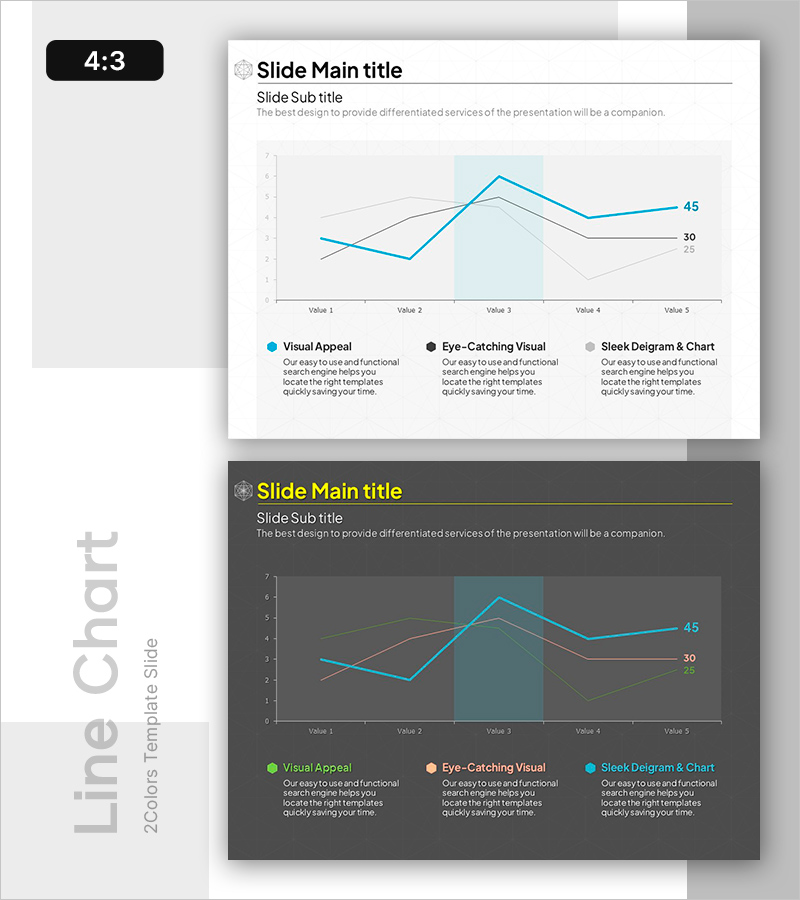
Investigating Specific Ranges in Scientific Line Graphs – Performance and Competitor Analysis
#Business Promotion Strategy #Market and Competitor Analysis #Graph
-
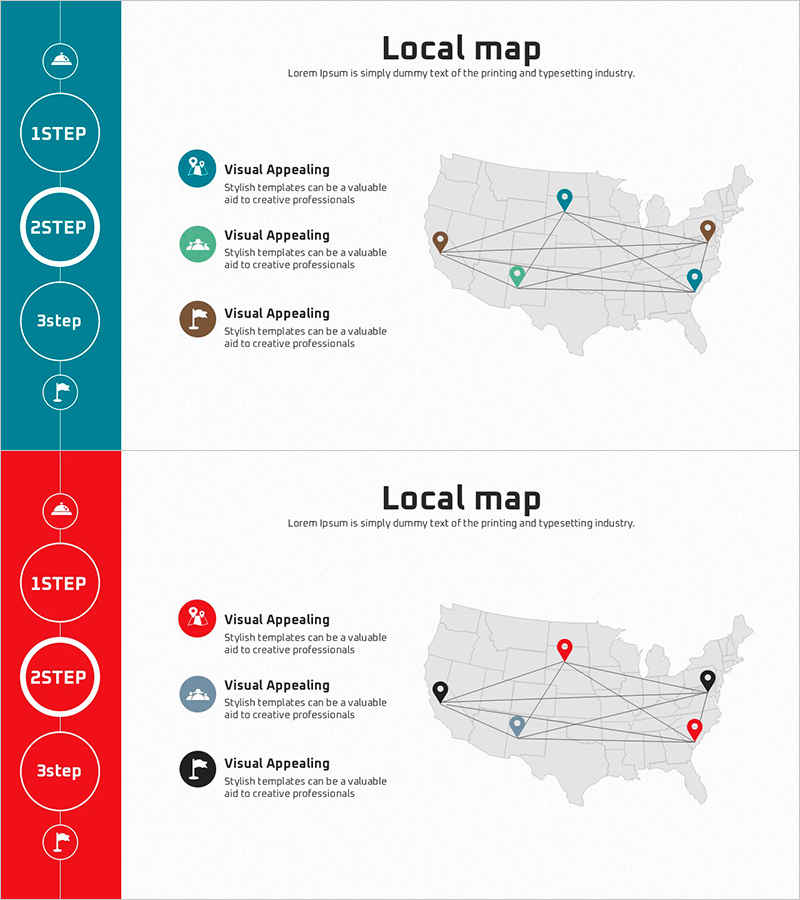
Visualizing Local Routes in a Business Diagram
#Company Introduction #Business Introduction #Diagram
-

Business Distribution Strategy – Multidirectional Flow Diagram
#Business Vision and Strategy #Marketing Plan and Strategy #Diagram
