Market and Competitor Analysis
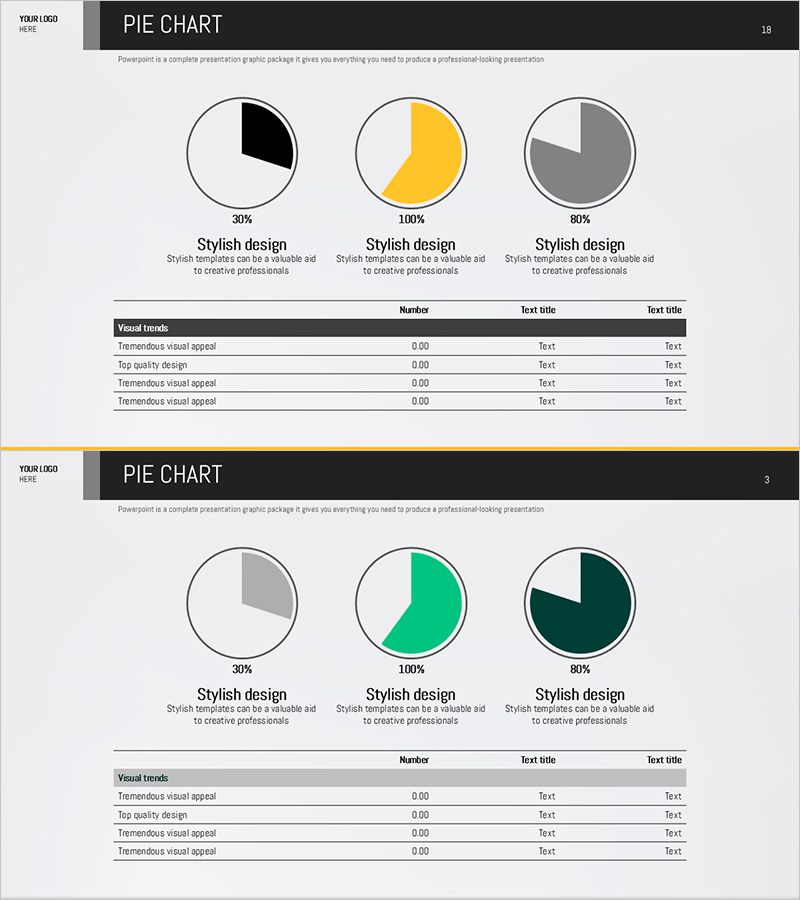
Pie Chart Analysis and Table – Visualizing Market Share
RJ0600038_17
- Last Update 12/21/2025
- File Size 0.2MB
- # of Slides 2
- File Format PPTX
- Slide Ratio 16:9
- Color
Keywords
About the Product
This slide utilizes pie charts to visualize and systematically present market share data. Featuring an appealing yellow and green color scheme, it captures the audience's attention while providing clear data comparisons and logical connections. Ideal for delivering key insights, it plays a critical role in market and competitive analysis reports. The dynamic mix of yellow and green evokes a sense of energy while also conveying stability. The editing difficulty is rated as easy, allowing for straightforward text and data replacement.
Related Products
-
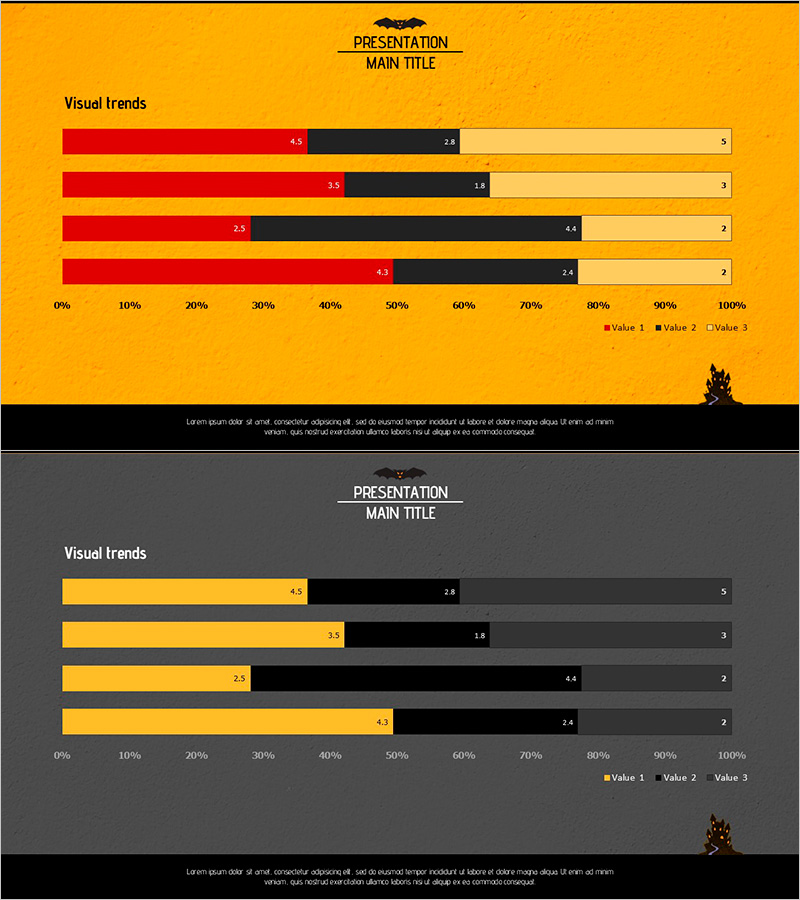
Red-Yellow Segmentation Chart – Overview of Visual Trends
#Graph
-

Key Personnel Capability Analysis Slide - Visualizing Team Strengths
#Company Introduction #Graph #Manpower
-
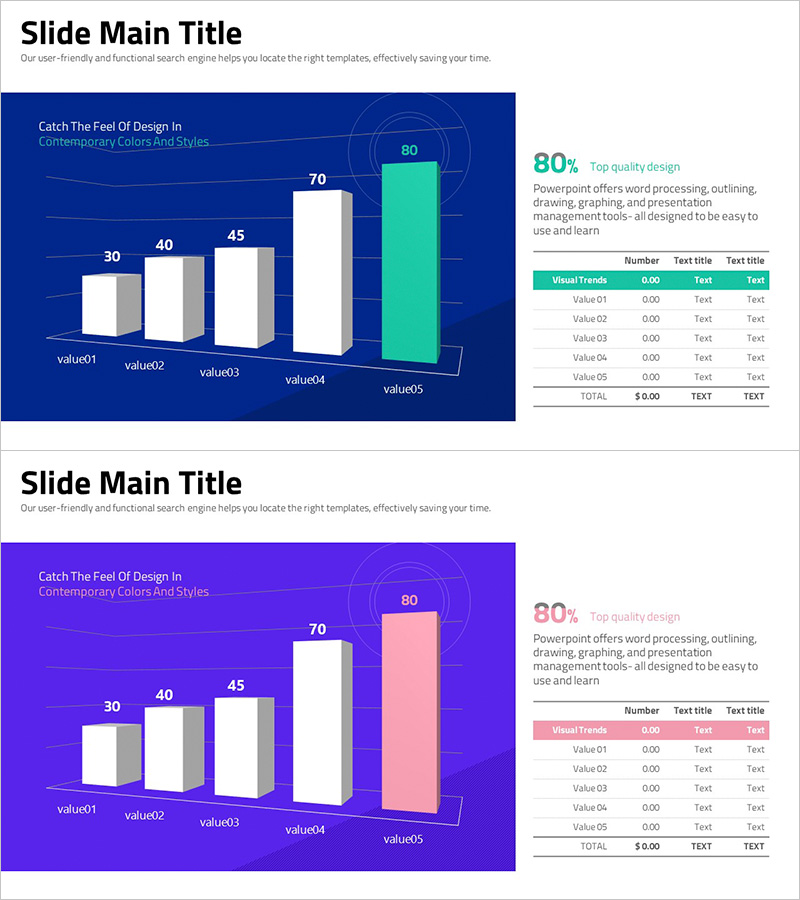
Data Visualization through Vertical Bar Graph – Effective Presentation
#Market and Competitor Analysis #Graph #Future Outlook
-
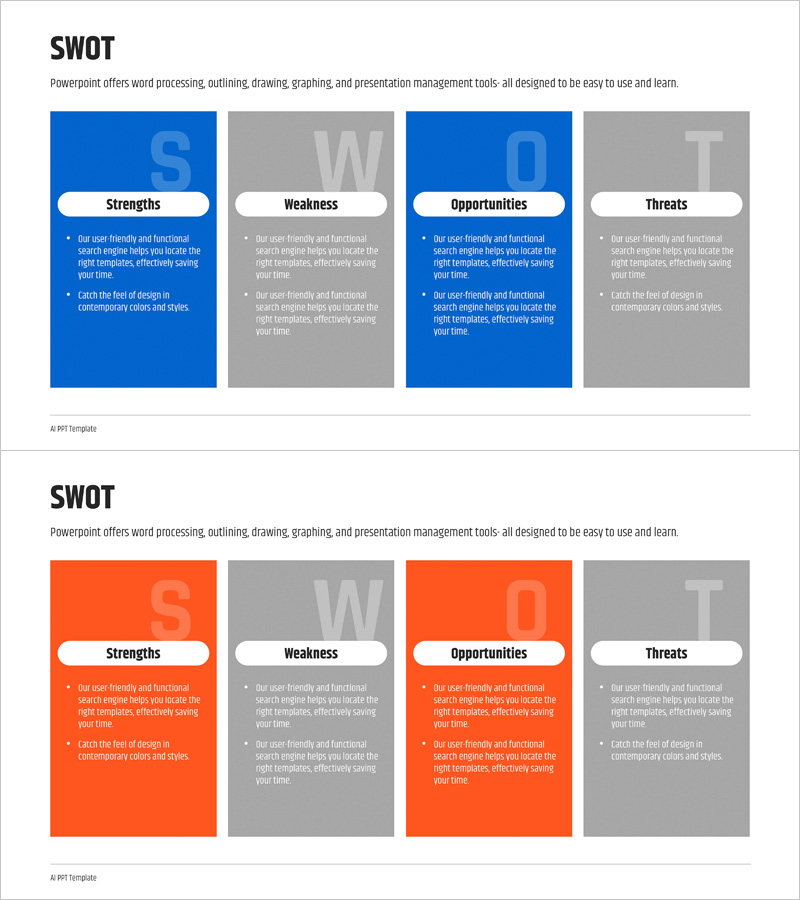
SWOT Analysis Square Diagram – Essence of Market Analysis
#Market and Competitor Analysis #Diagram #SWOT Analysis
