Product/Service
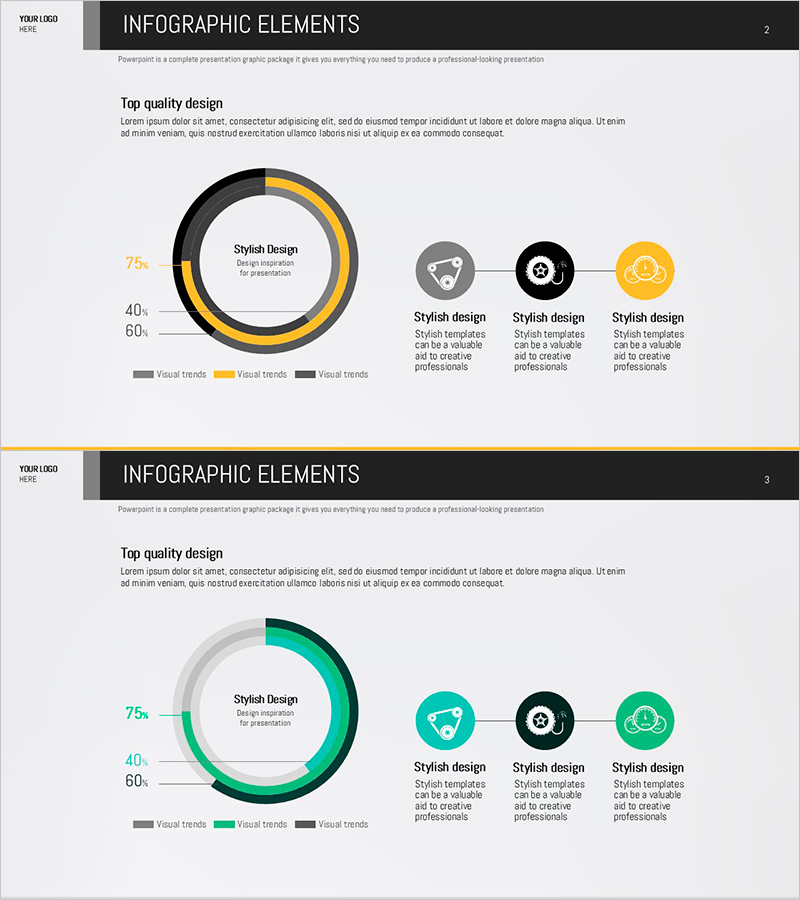
Status of Parts Production and Development – Donut Chart Infographic
RJ0600038_11
- Last Update 12/21/2025
- File Size 0.3MB
- # of Slides 2
- File Format PPTX
- Slide Ratio 16:9
- Color
Keywords
About the Product
This slide features a donut chart infographic that visually conveys the status of parts production and development. The intuitive structure allows for effective sharing of technical status, making it suitable for showcasing technology development and project progress. The main colors yellow and green provide vibrancy, while the teal accents create a polished and professional image. It is useful in business presentations where technology development status is discussed. The editing difficulty is rated as 'easy', with straightforward replacement of text and graphic elements.
Related Products
-
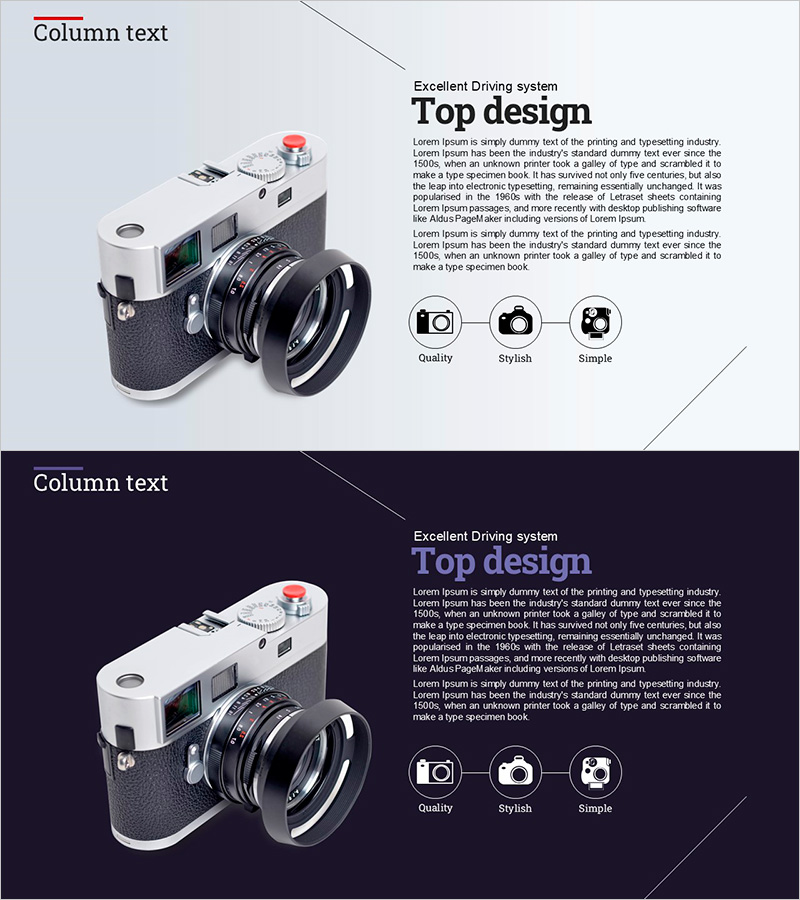
Camera Characteristics and Overview – Quality and Stylish
#Product/Service #Other #Product and Service Overview
-
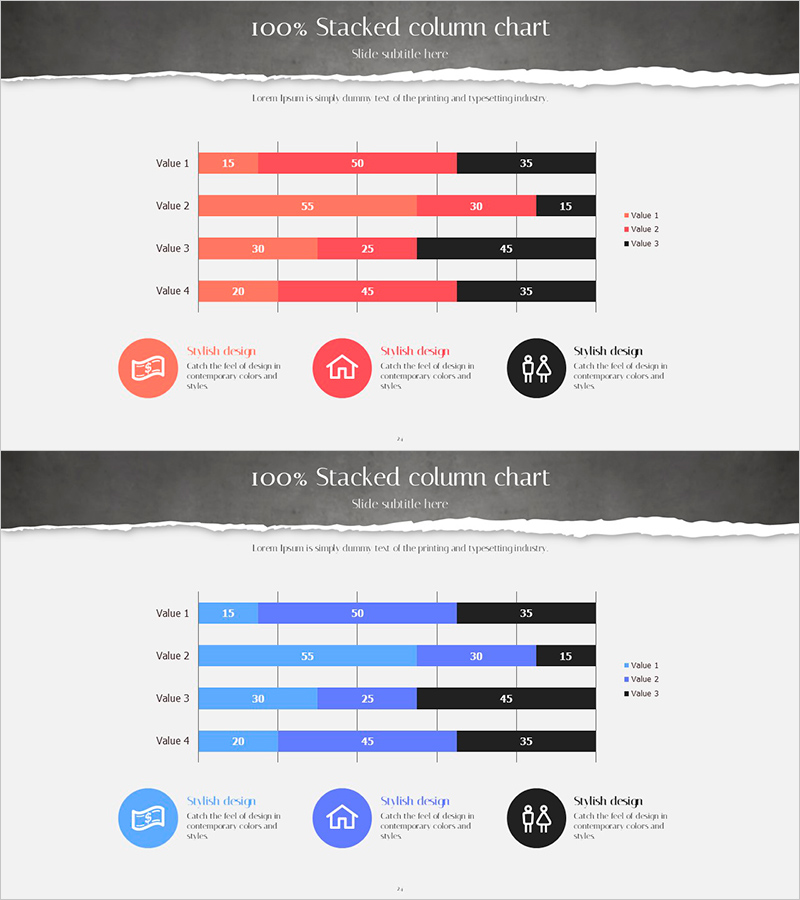
Work and Home Life Graph – Market Trends and Design Sensibility
#Market and Competitor Analysis #Graph #Industry Trends
-
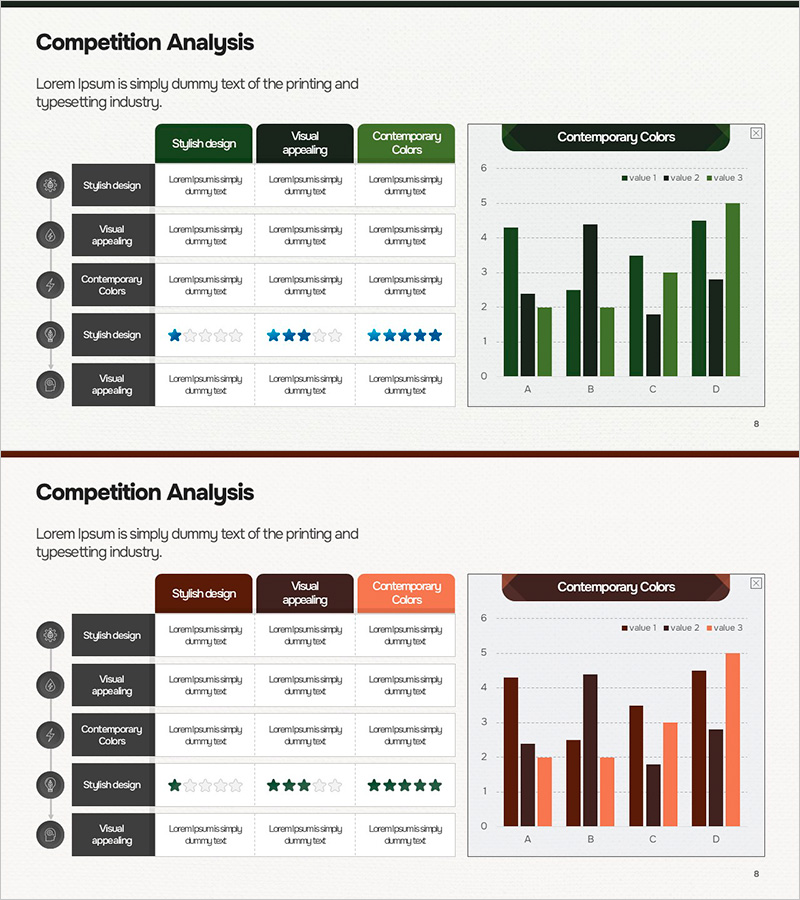
Business Plan Competitor Analysis Chart – Effective Market Analysis Tool
#Market and Competitor Analysis #Diagram #Graph
-
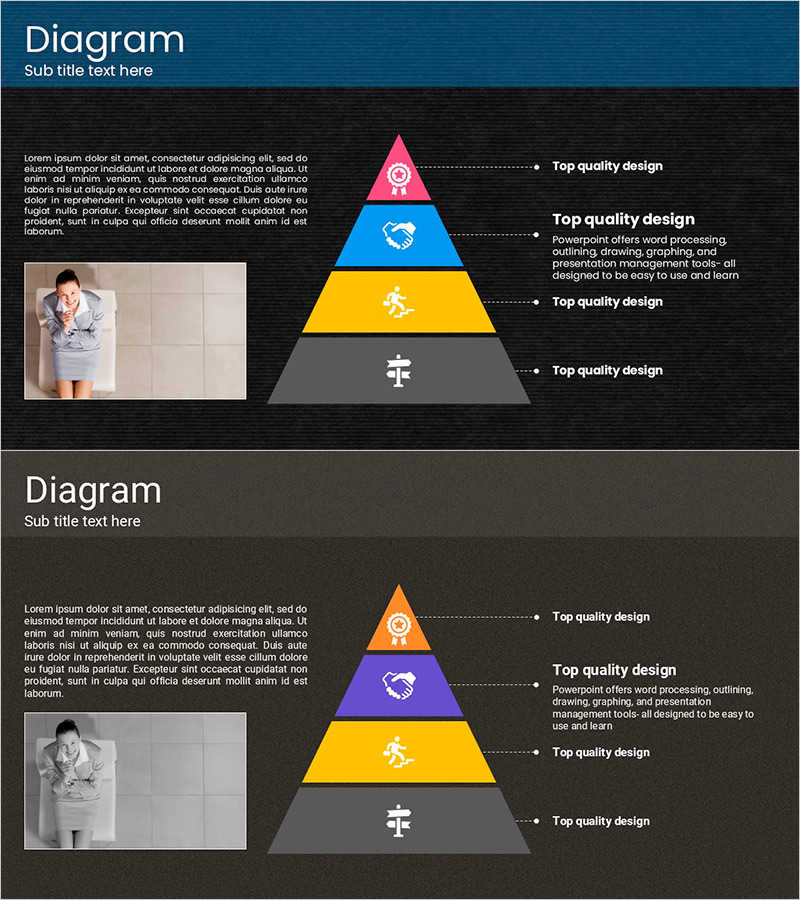
Visualizing Business Strategy with Pyramid Diagram – Revenue Model Explanation
#Business Introduction #Marketing Plan and Strategy #Revenue Model
