Diagram
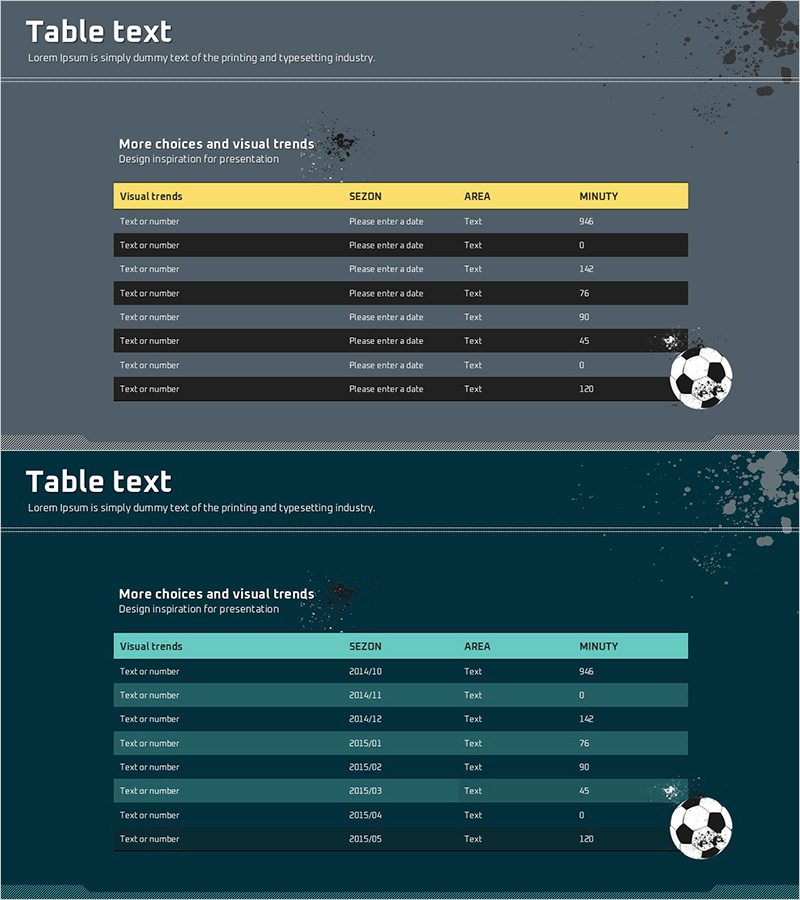
Football Result Table – Sports Data Visualization
RJ0600037_11
- Last Update 12/21/2025
- File Size 0.6MB
- # of Slides 2
- File Format PPTX
- Slide Ratio 16:9
- Color
About the Product
This slide features a table format designed to systematically organize football match results. Utilizing dynamic colors of yellow and green, it allows for a quick overview of professional sports statistics. This design is appropriate for data analysis and sports performance presentations, offering a friendly and intuitive table structure. It can be used for internal business reports as well as for sports team performance presentations, press conferences, and educational materials. The editing process is easy, enabling quick replacements of text and numerical data.
Related Products
-
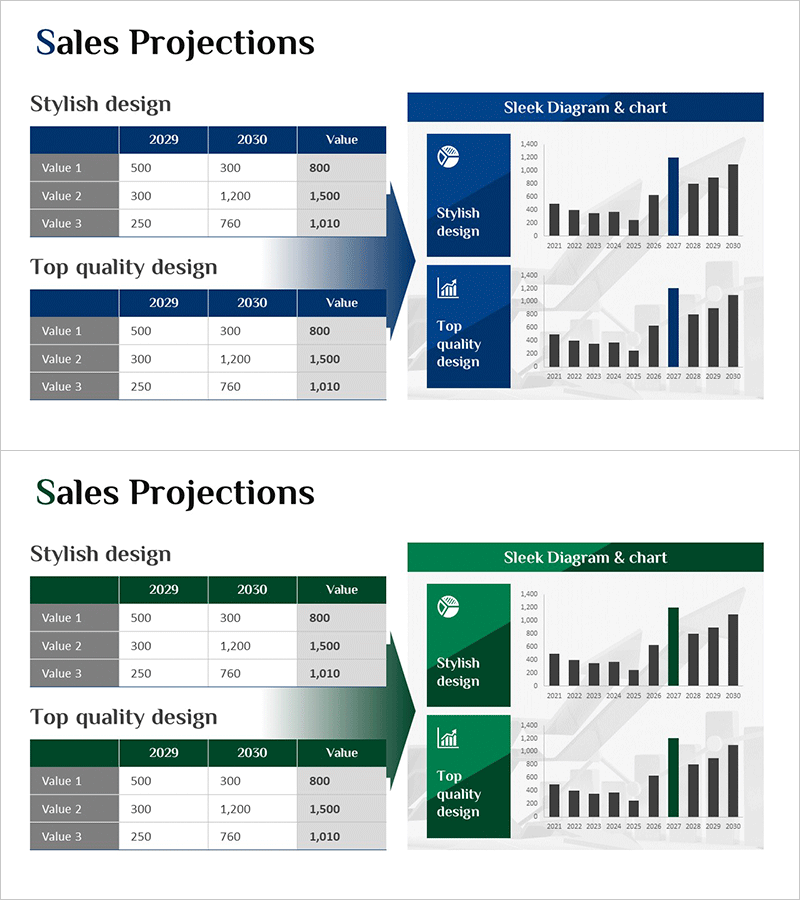
Sales Outlook Table & Bar Chart – Market and Financial Insights
#Market and Competitor Analysis #Financial Plans and Performance #Diagram
-
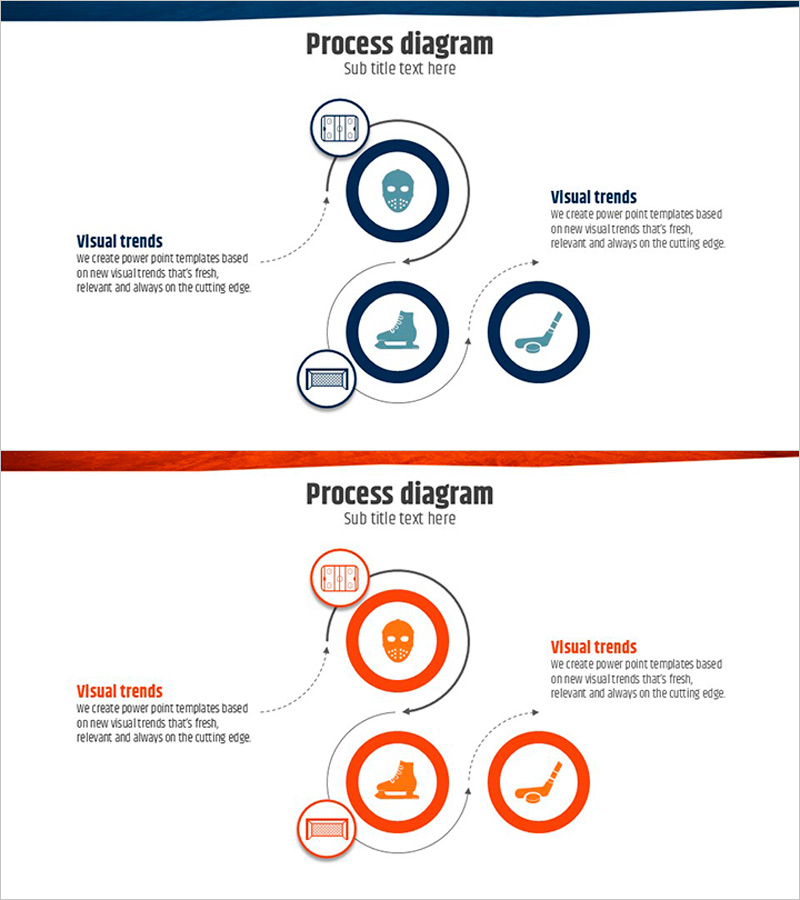
Ice-Playing System – Effective Workflow Visualization
#Business Promotion Strategy #Operation Plan #Diagram
-
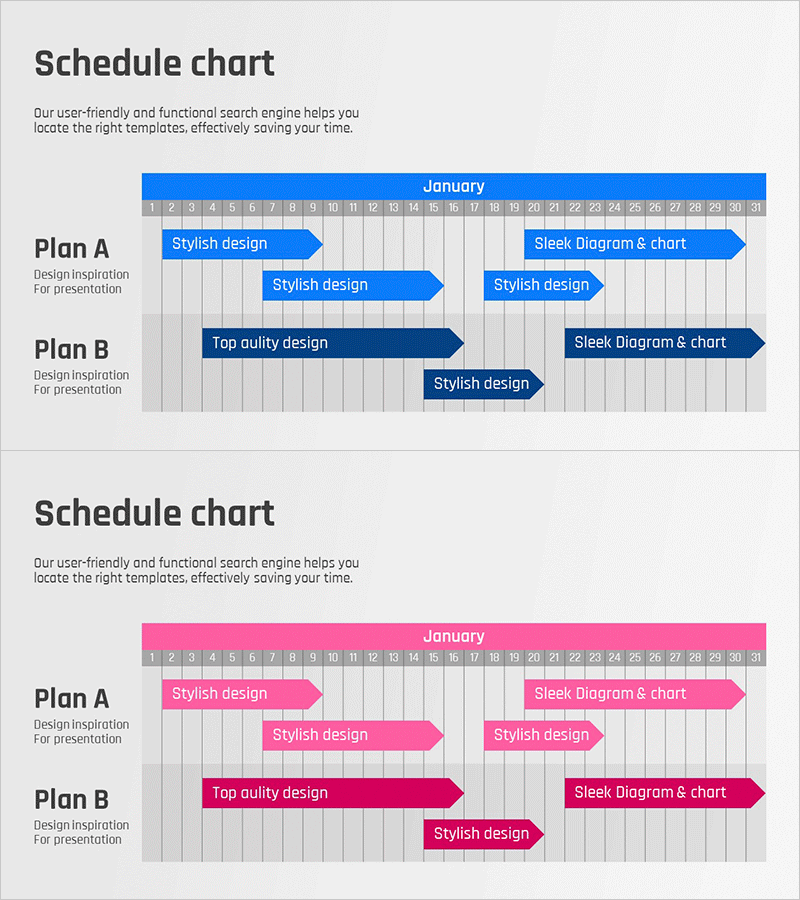
January Schedule Planning Diagram – Presentation Template for Efficient Planning
#Business Management #Operation Plan #Diagram
-
Product Sales Plan Outline – A New Paradigm in Business Management
#Business Introduction #Business Management #Diagram
