Business Introduction
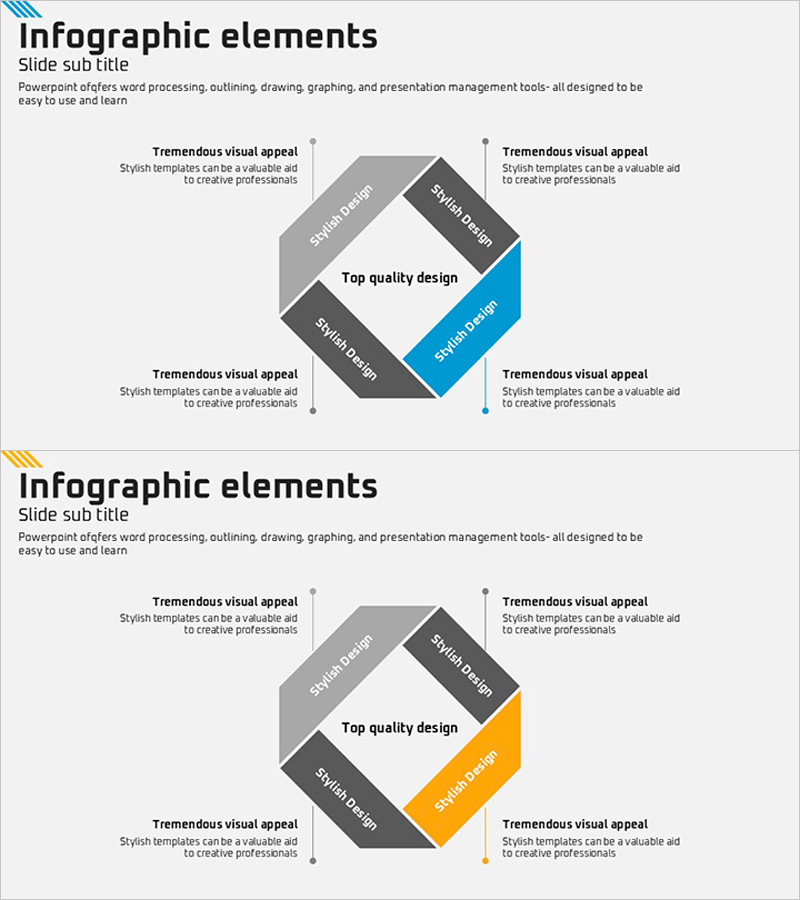
Connection Infographic Diagram – Business Overview and Revenue Model
RJ0600021_9
- Last Update 12/21/2025
- File Size 0.1MB
- # of Slides 2
- File Format PPTX
- Slide Ratio 16:9
- Color
Keywords
About the Product
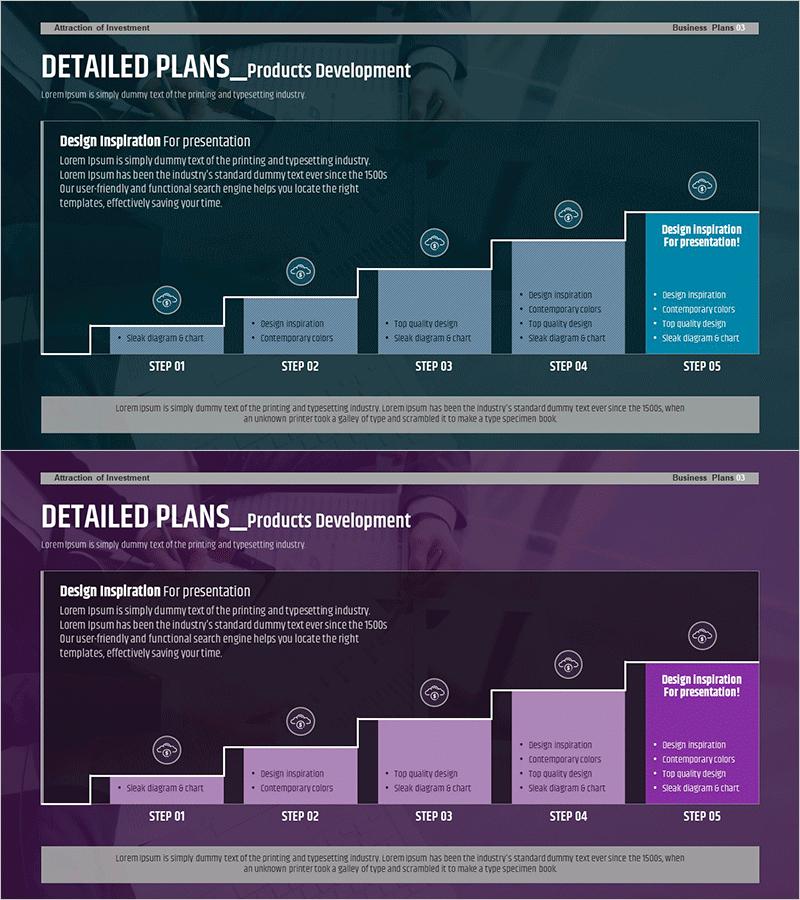
This slide template utilizes a connection infographic diagram to visually showcase business overview and revenue models effectively. The harmonious blend of blue and yellow enhances visual appeal while emphasizing the centrality of information through a cluster structure. This template is versatile and can be used for various purposes, including corporate introductions, business plans, and strategic presentations. It particularly excels in conveying business overviews and models, capturing the audience's attention with strong persuasive power. The text and design elements on the slide are easily interchangeable, and the editing difficulty is rated as 'easy', making it user-friendly for everyone.
Related Products
-
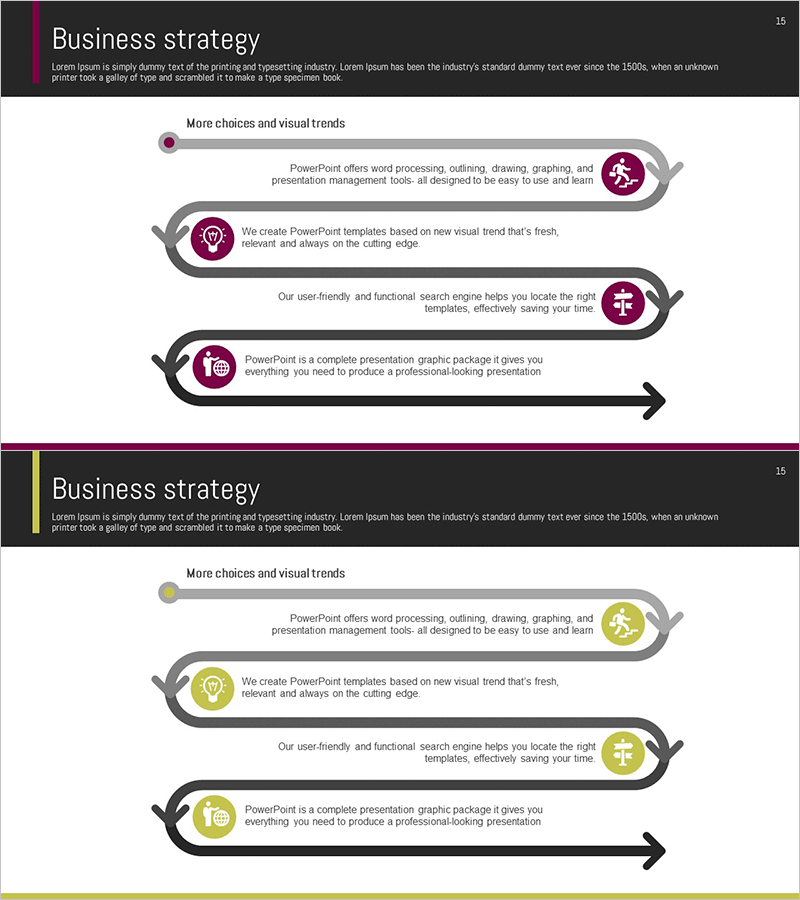
Step-by-Step Flow Diagram – Visualizing Business Strategy
#Business Vision and Strategy #Business Promotion Strategy #Diagram
-
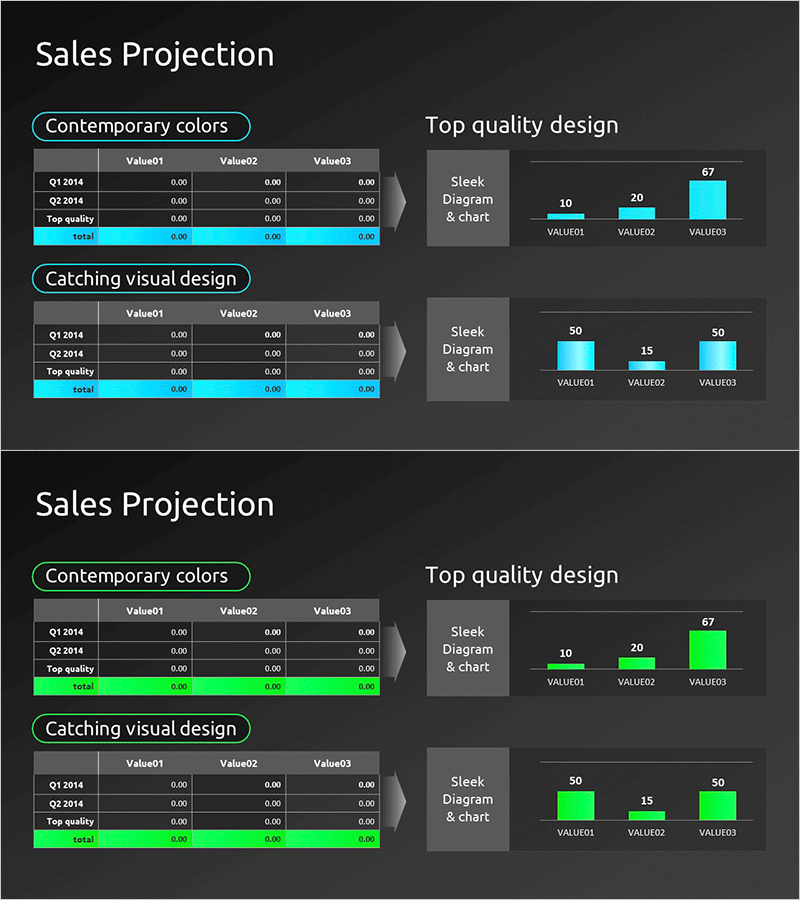
Sales Outlook Analysis Chart – Sleek Data Visualization
#Market and Competitor Analysis #Financial Plans and Performance #Diagram
-
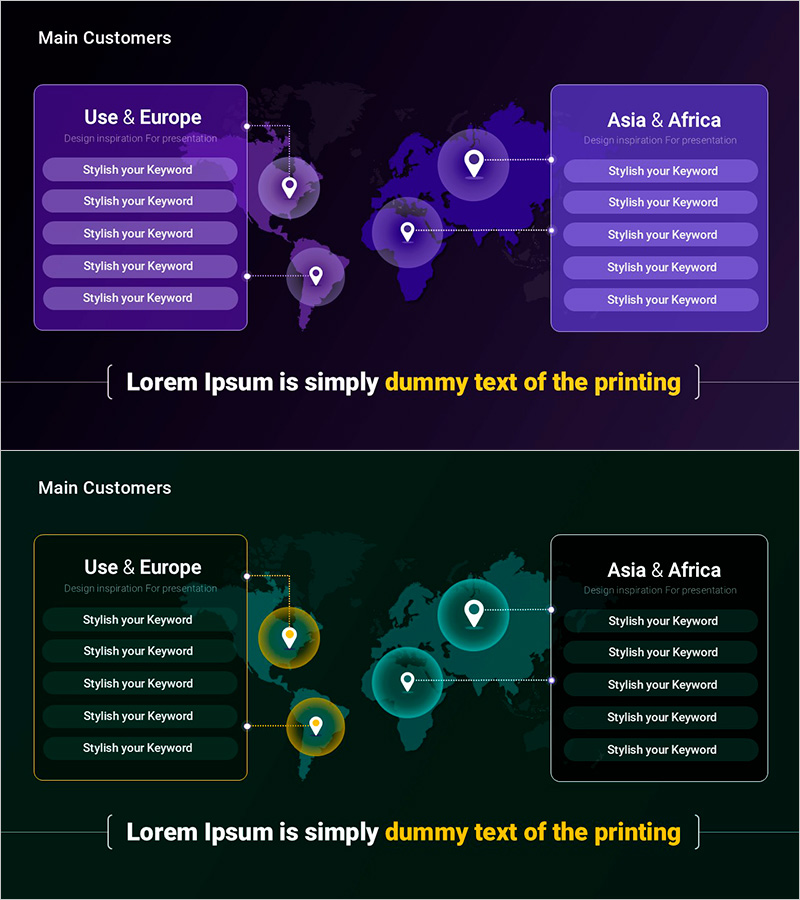
Global Key Clients Presentation Slide – Network Visualization
#Company Introduction #Diagram #Other
-
Research and Development Schedule and Goal Layer Diagram
#Product/Service #Business Promotion Strategy #Diagram
