Market and Competitor Analysis
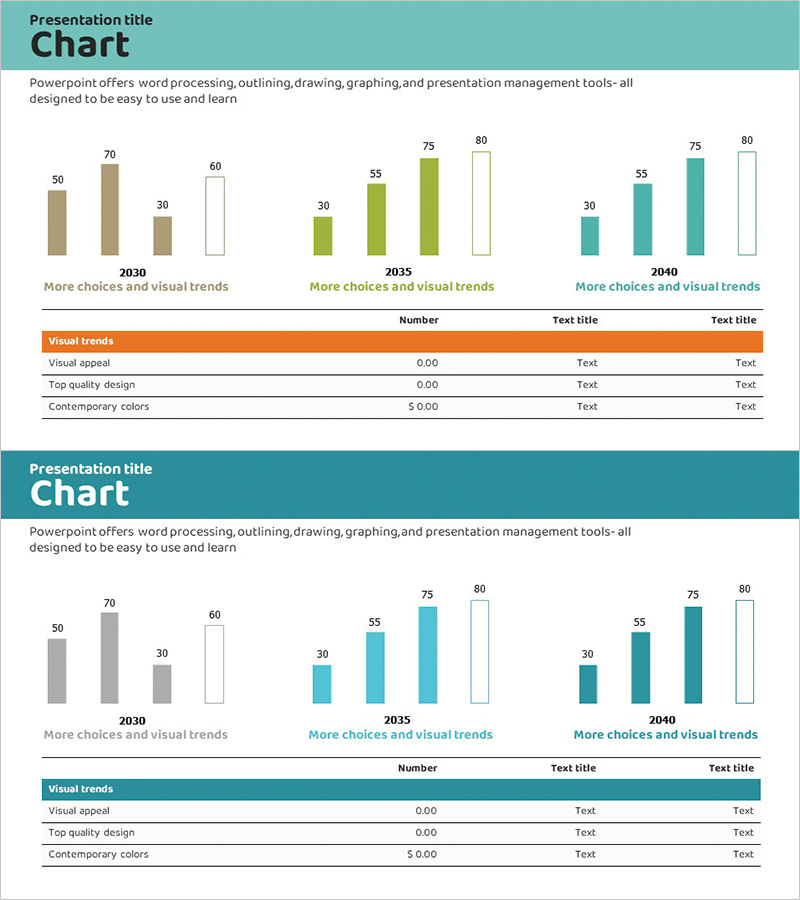
Carbon Neutral Market Share Chart – Visualizing Competitive Advantage
RJ0600018_28
- Last Update 12/21/2025
- File Size 0.5MB
- # of Slides 2
- File Format PPTX
- Slide Ratio 16:9
- Color
Keywords
About the Product
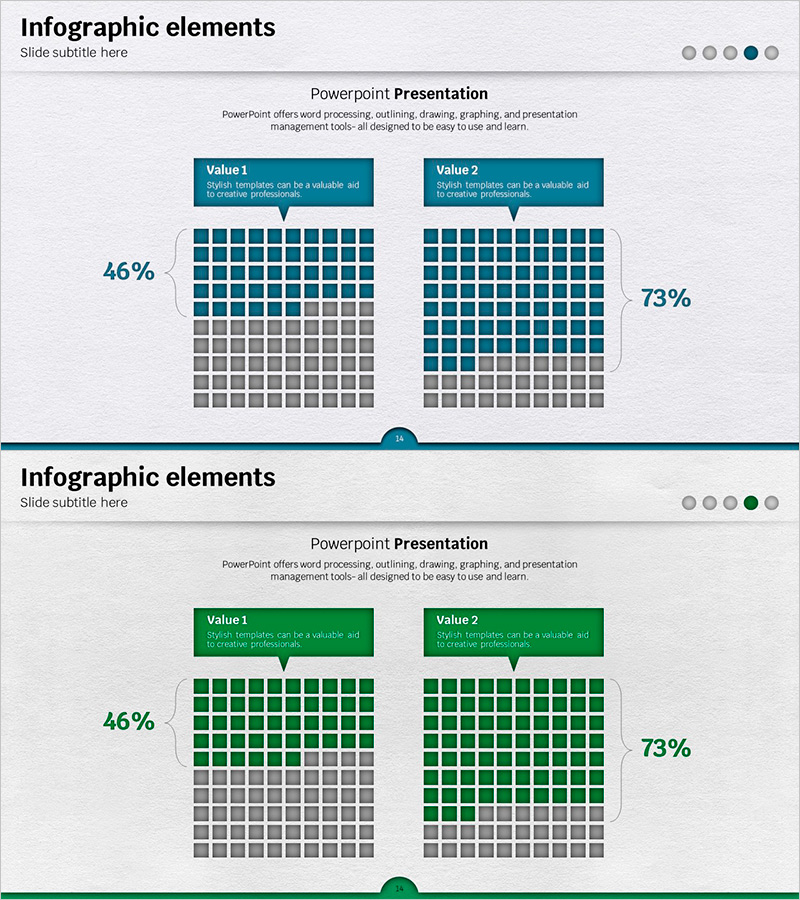
This slide features a horizontal bar chart visually representing the market share concerning carbon neutrality. Composed of a harmonious combination of brown and blue, this chart is useful for businesses analyzing their carbon neutrality performance or evaluating market positioning. It clearly reveals growth trends over the years and is particularly focused on highlighting competitive advantages that can significantly influence corporate decision-making. Texts and data are easy to replace, and the editing difficulty is rated as 'easy', allowing for quick integration into various presentations.
Related Products
-
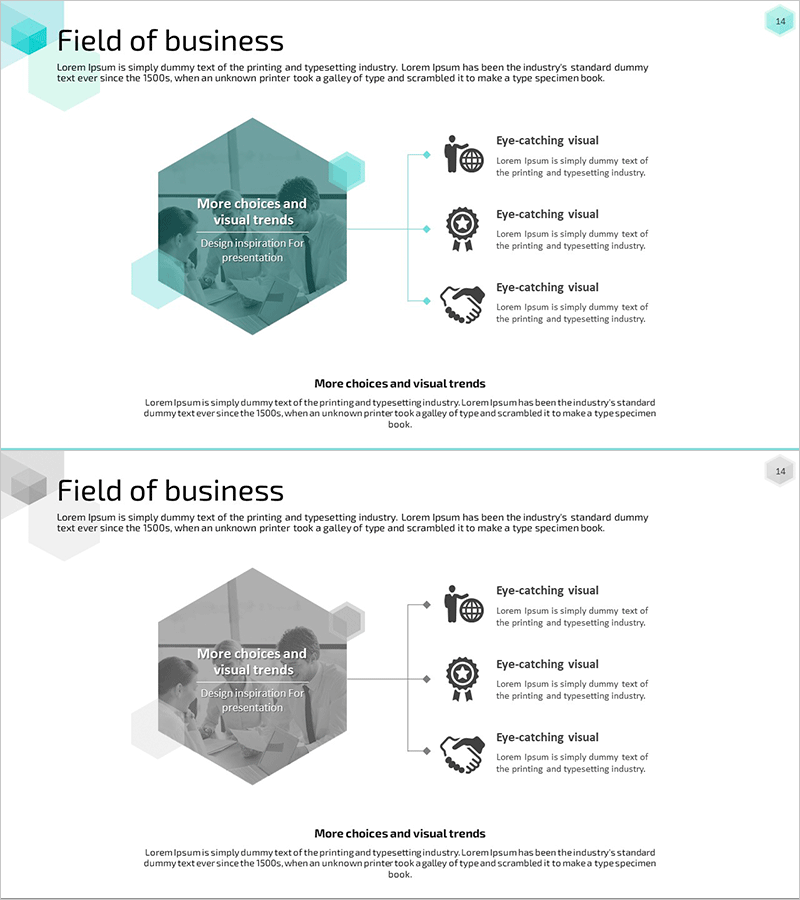
Business Sector Structure Hexagon Diagram – Visual Trend Introduction
#Company Introduction #Business Introduction #Diagram
-
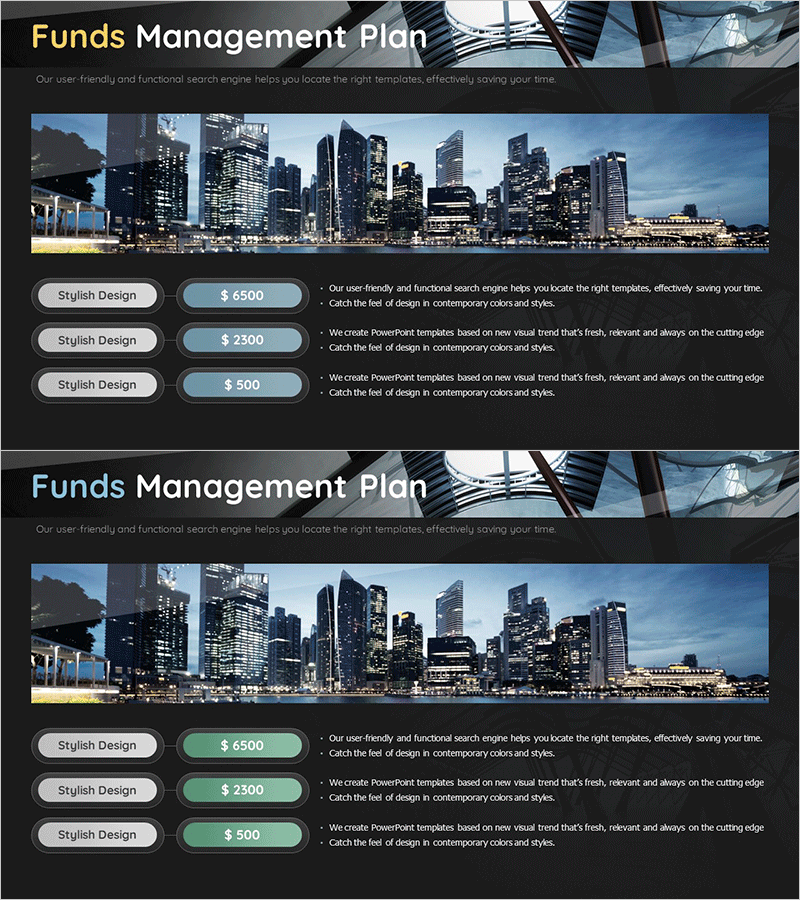
Construction Project Fund Management Plan – Designing Financial Plans and Performance
#Financial Plans and Performance #Diagram #Capital Requirement Plan
-
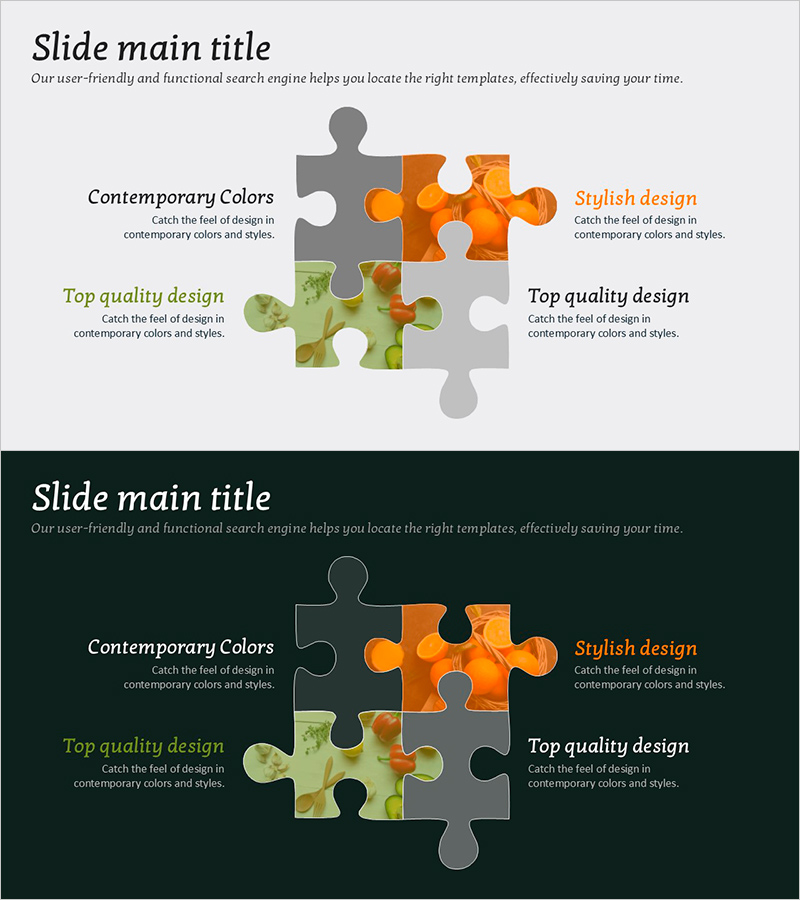
Fruit and Puzzle Diagram – Visualizing Business Strategies
#Business Promotion Strategy #Business Management #Diagram
-
Rainbow Presentation Template Infographic Elements – Market Share Analysis
#Business Vision and Strategy #Market and Competitor Analysis #Graph
