Market and Competitor Analysis
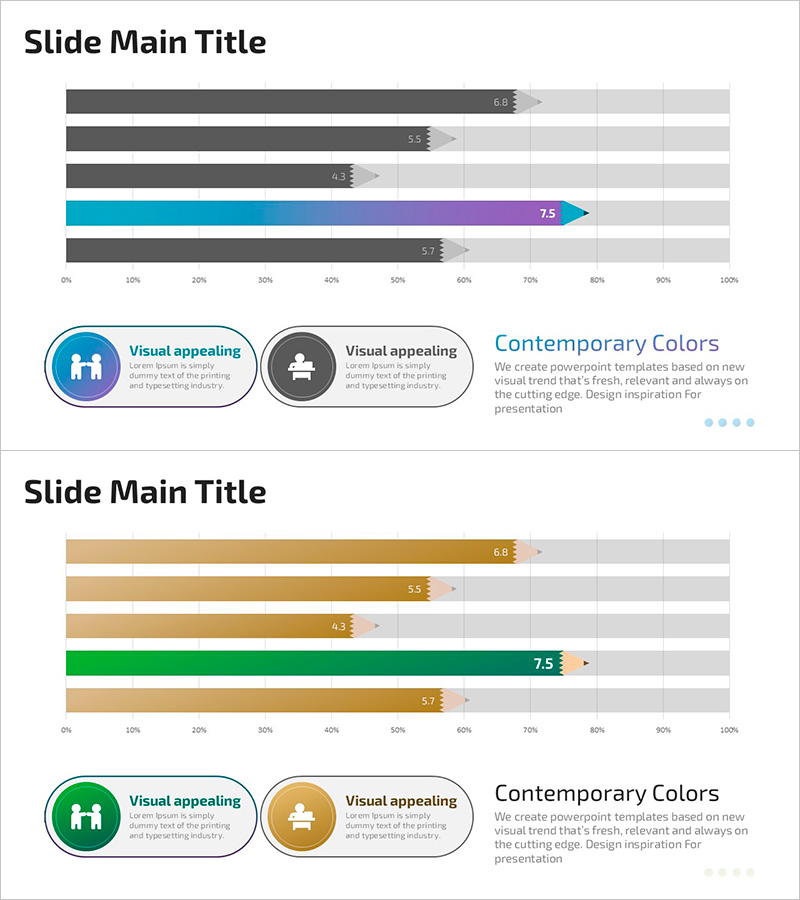
Graphs of Learning and Growth – Visual Data Presentation
RJ0500038_15
- Last Update 12/21/2025
- File Size 0.4MB
- # of Slides 2
- File Format PPTX
- Slide Ratio 16:9
- Color
Keywords
About the Product
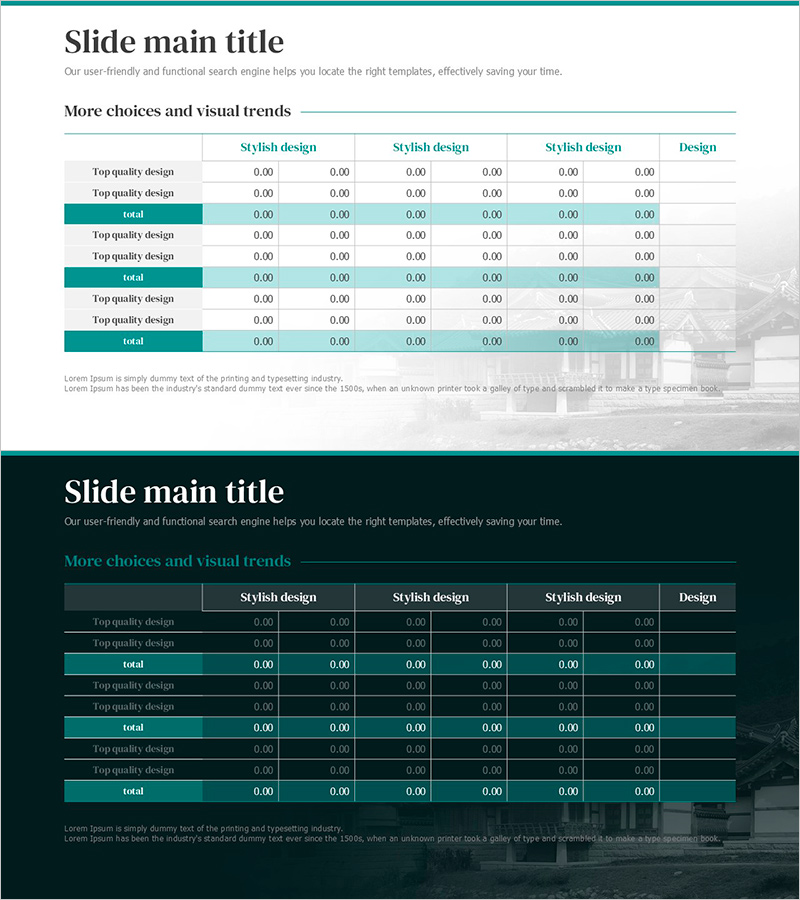
This slide features a horizontal bar graph designed primarily to illustrate the processes of learning and growth, providing a clear visual comparison of data. The harmonious palette of brown, blue, and green creates a stable and professional appearance, with strong emphasis on the title and layout. It is suitable for business presentations related to market and competitor analysis, effectively communicating team growth or project progress. Users can easily swap out text and data fields, with an editing difficulty rated as 'easy' for quick adaptation to various business needs.
Related Products
-
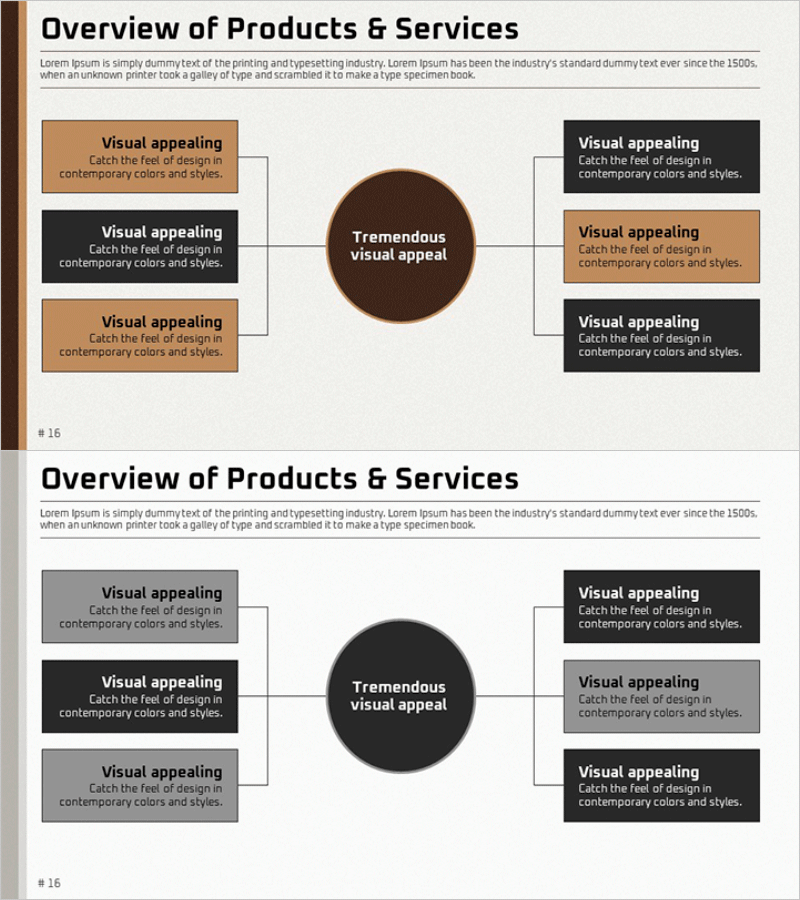
Product and Service Overview Diagram – Structural Visualization
#Product/Service #Diagram #Product/Service Introduction
-
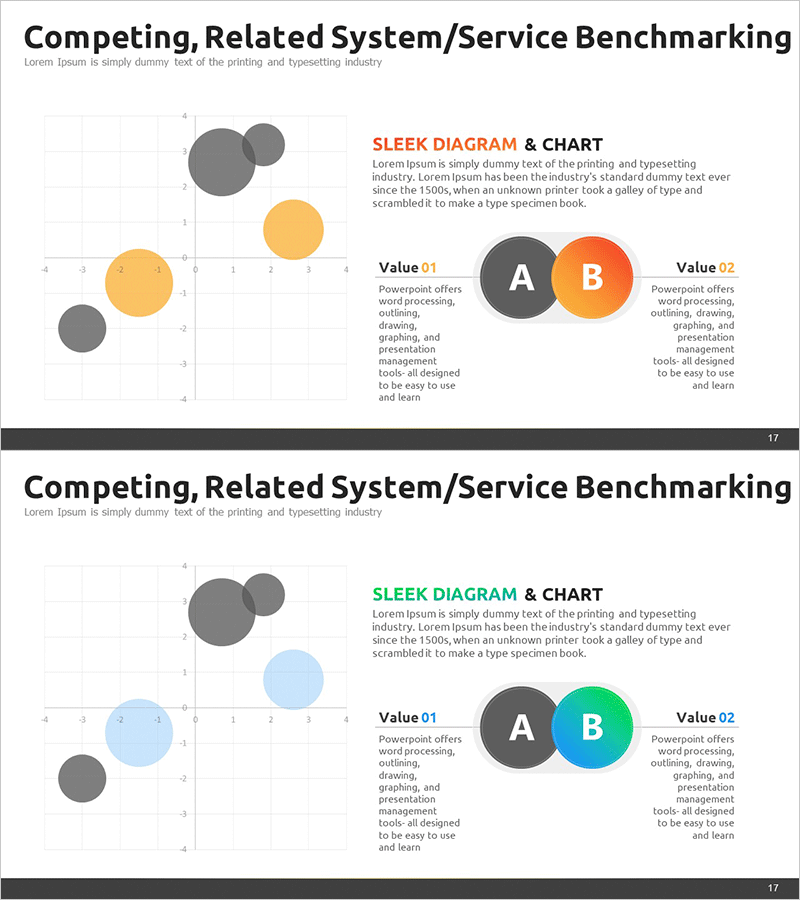
Competitive Market Positioning Analysis Slide
#Market and Competitor Analysis #Marketing Plan and Strategy #Graph
-
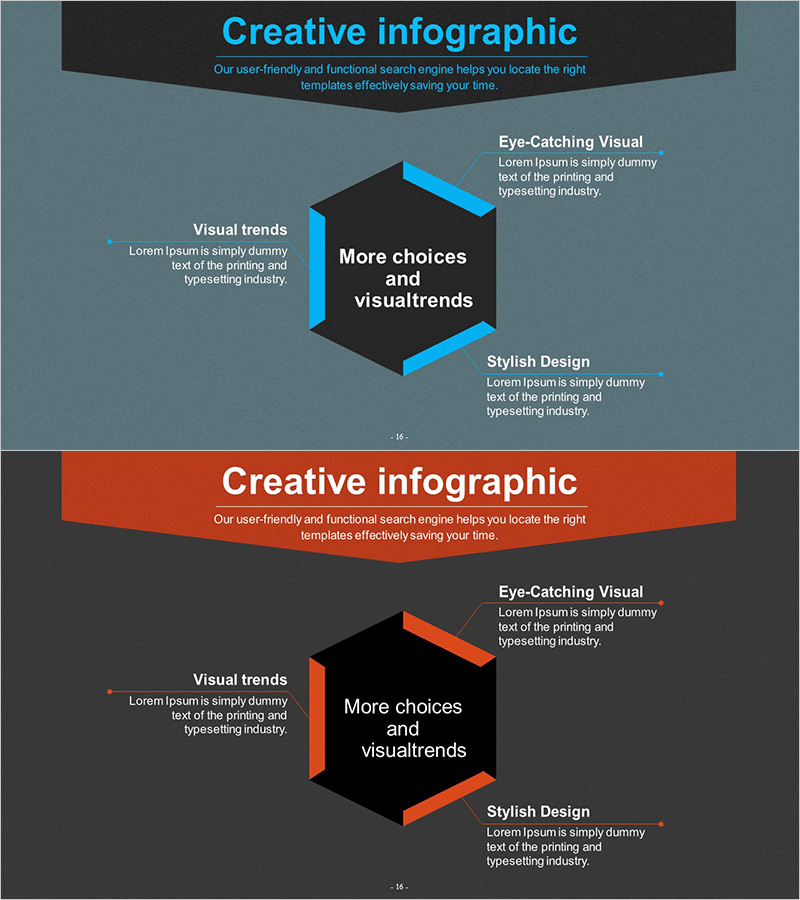
Marketing Strategy Hexagon Diagram – Innovative and Creative Template
#Product/Service #Marketing Plan and Strategy #Diagram
-
Tourist Visitor Status Table – Informative and Visual Benefits
#Product/Service #Financial Plans and Performance #Diagram
