
Business Vision and Strategy
E-Learning Learning Effect Diagram – Visualizing Business Strategies
RJ0500037_26
- Last Update 12/21/2025
- File Size 1.9MB
- # of Slides 2
- File Format PPTX
- Slide Ratio 16:9
- Color
Keywords
About the Product
This slide features an e-learning learning effect diagram that visually represents the effectiveness of educational activities. With a combination of green and orange colors, it emphasizes the impact of training and effectively communicates business vision and strategy. The diagram integrates complex data through clusters and connections, making it ideal for performance reports, strategic planning presentations, or internal training materials.
Related Products
-
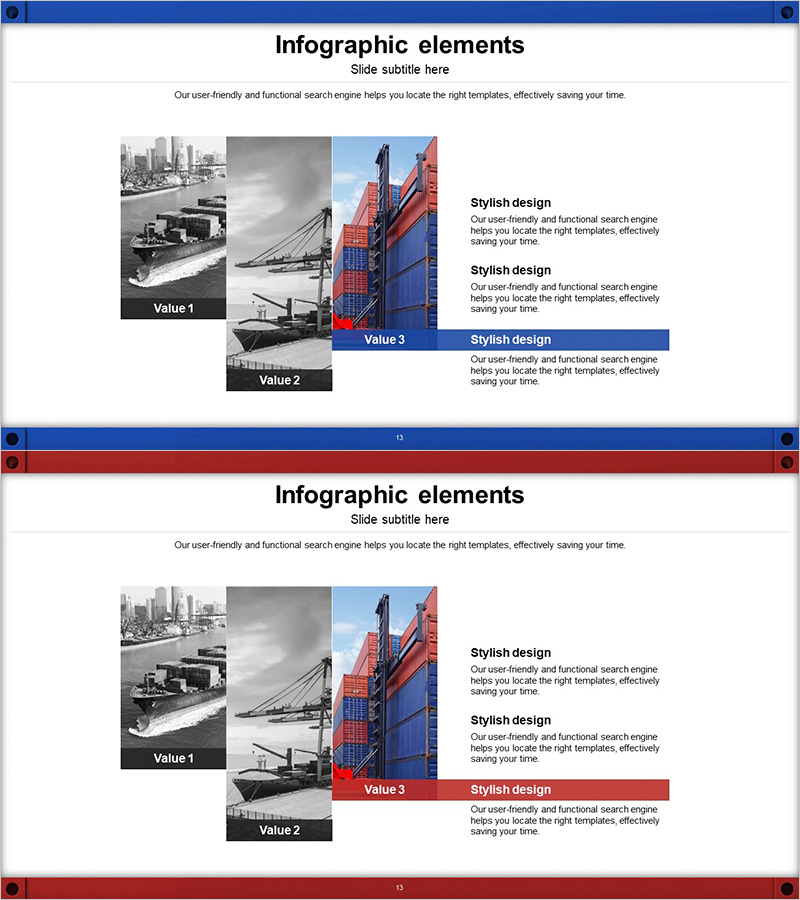
Visual Breakdown of Port Logistics
#Product/Service #Business Vision and Strategy #Diagram
-
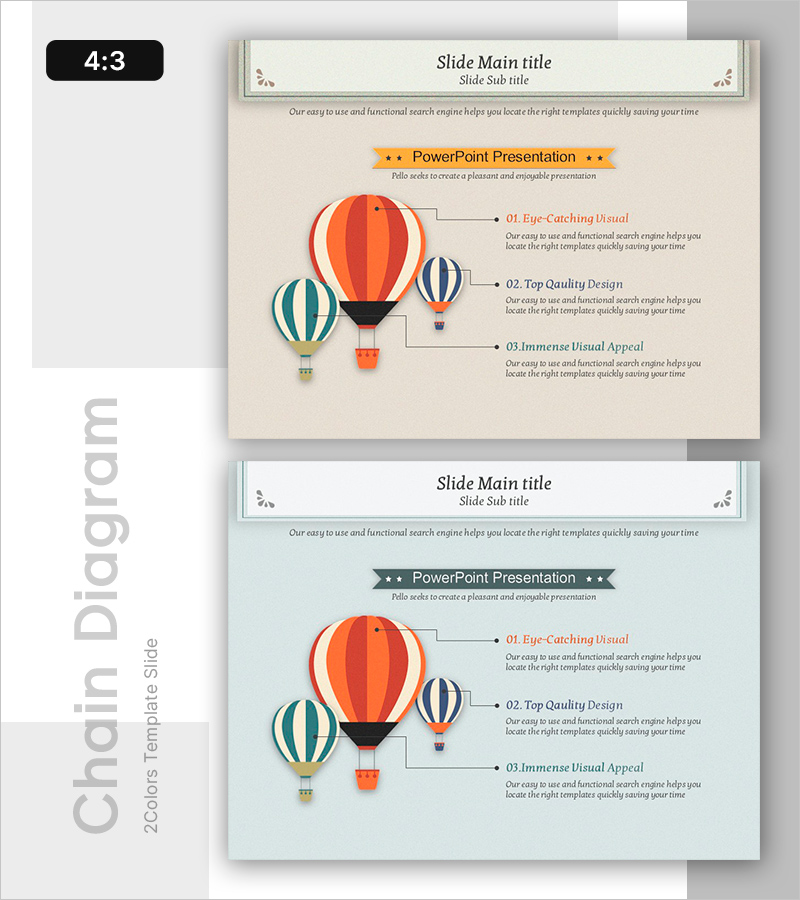
Theme Park Hot Air Balloon Guide – Captivating Visuals
#Product/Service #Diagram #Product/Service Introduction
-

Comparison of Component-Specific Responses According to Conditions
#Business Promotion Strategy #Technology Sector #Graph
-

Strategic Saving & Asset Diversification Plan Slide Template
#Product/Service #Financial Plans and Performance #Diagram
