Financial Plans and Performance
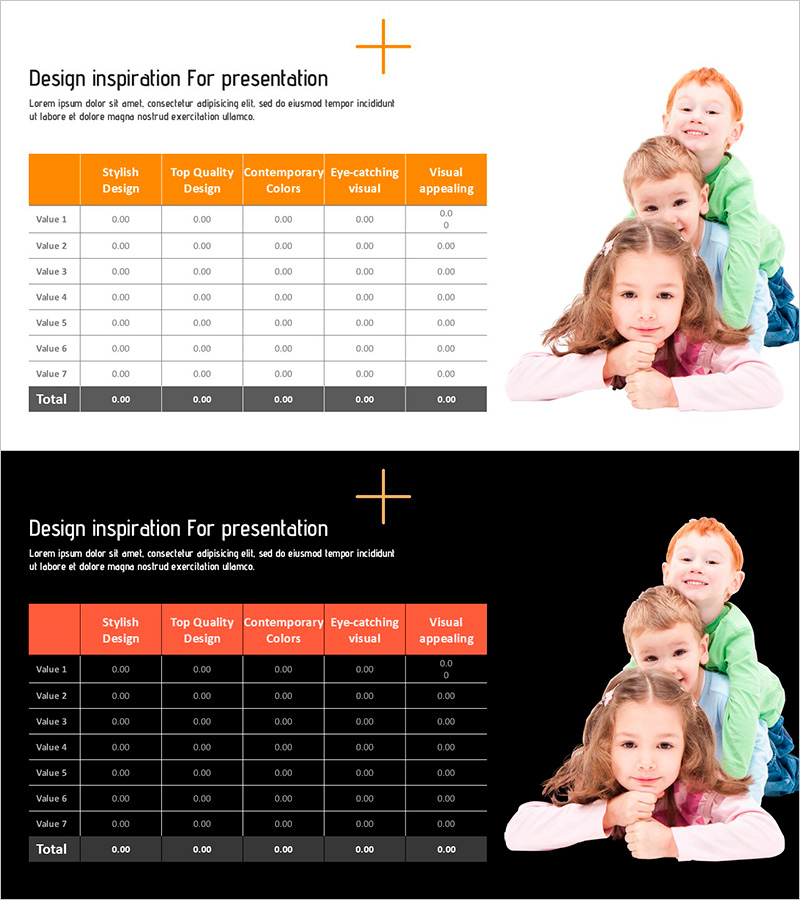
Love and Data Charts – Visualizing Financial Performance
RJ0500037_14
- Last Update 12/21/2025
- File Size 1MB
- # of Slides 2
- File Format PPTX
- Slide Ratio 16:9
- Color
Keywords
About the Product
This slide highlights financial performance through charts that beautifully blend love and data. The warm tones of orange and red create a dynamic yet inviting feel, structured for clarity. It is well-suited for various budget classifications and revenue analyses, effectively conveying crucial financial information. Ideal for practitioners and entrepreneurs, this slide features an integrated design of charts and tables, with a moderate editing difficulty level, allowing easy updates of text and data as needed.
Related Products
-
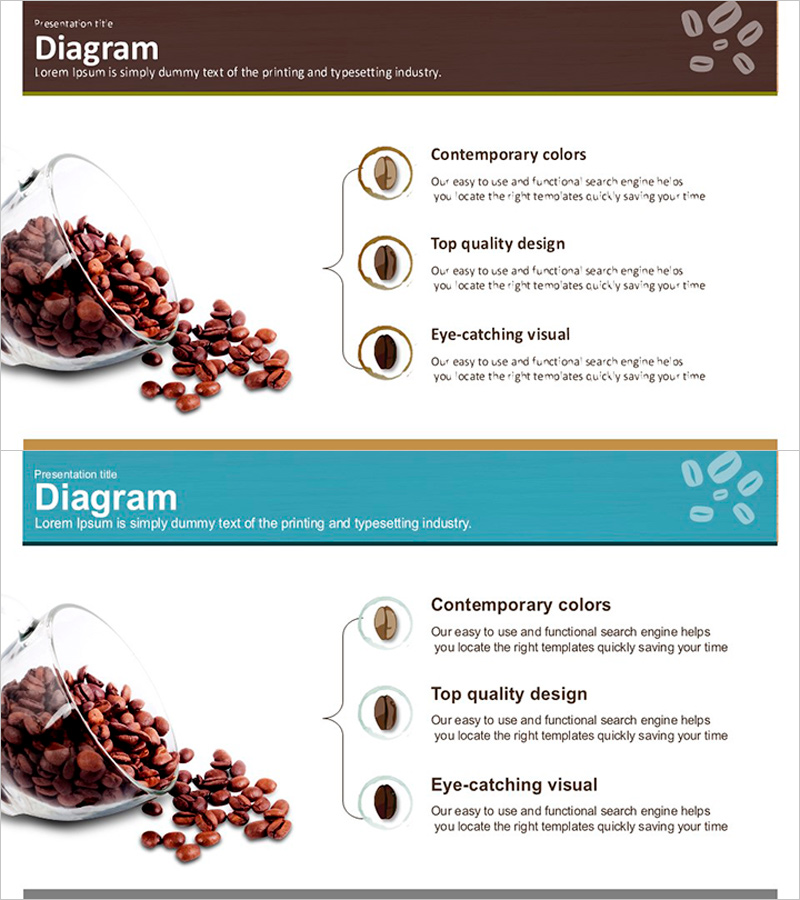
Types and Characteristics of Coffee Beans – Visual Infographic Slide
#Product/Service #Diagram #Composition
-
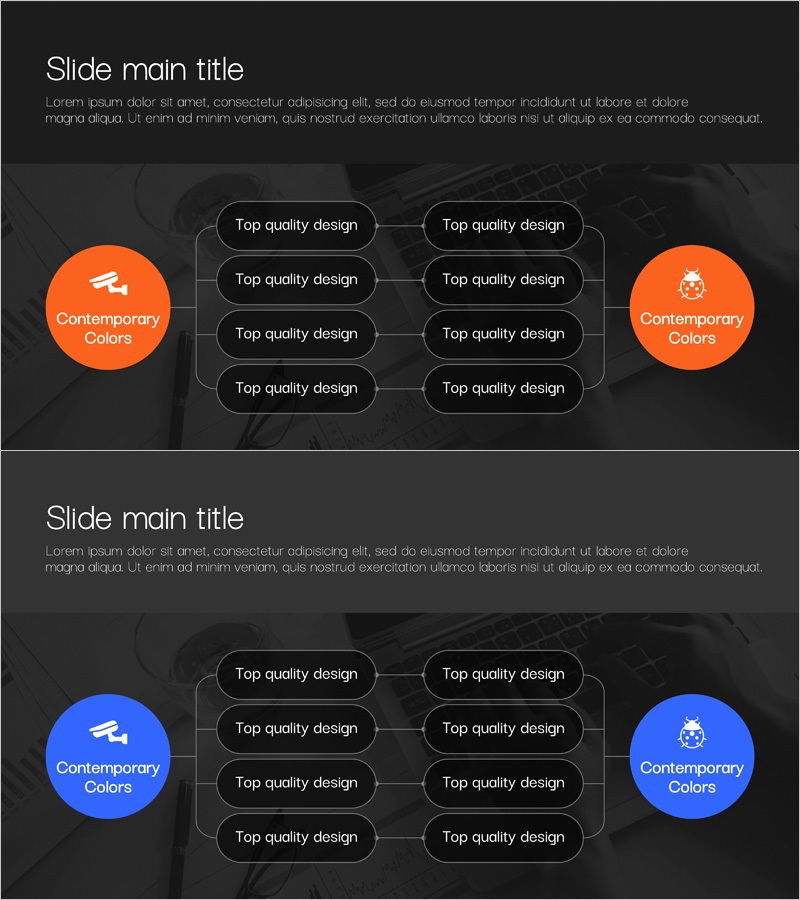
Business Relationship Diagram for Organizational Visualization – Effective System Structuring
#Company Introduction #Technology Sector #Diagram
-
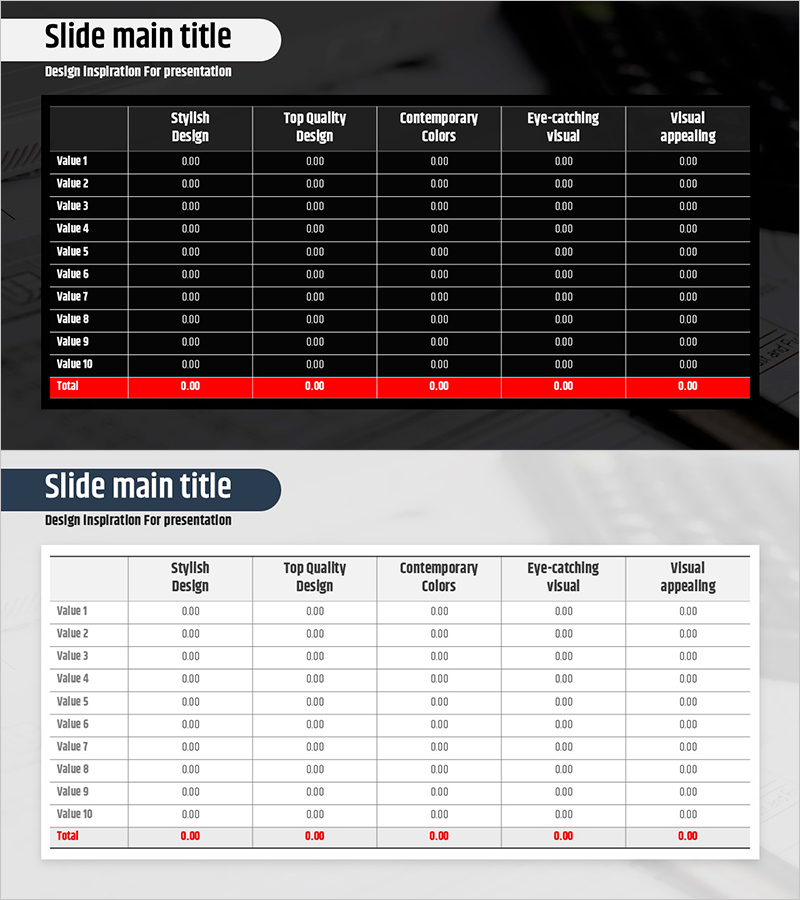
White Black Analysis Table for Comparative Analysis
#Diagram
-
3 Strategic Paths from One Core
#Company Introduction #Product/Service #Diagram
