Business Introduction
Three Area Comparison Graphs
RJ0500036_11
- Last Update 12/21/2025
- File Size 0.5MB
- # of Slides 2
- File Format PPTX
- Slide Ratio 16:9
- Color
Keywords
About the Product
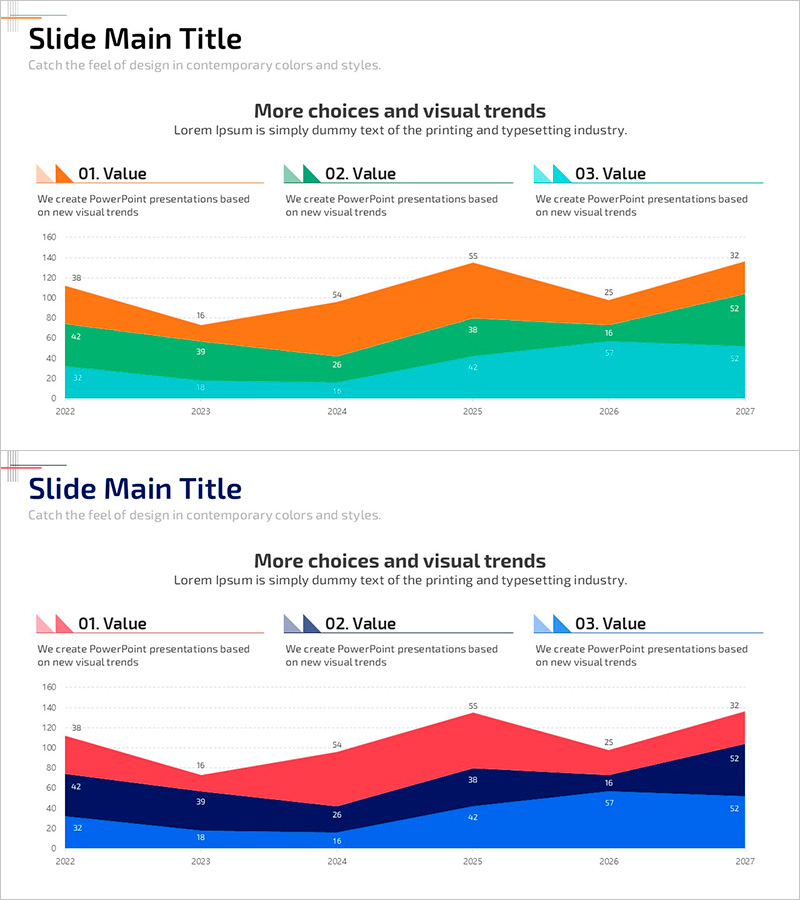
This slide effectively visualizes the trends of three areas through a comparison graph. Featuring modern design with appealing orange, red, and blue colors, it captivates the audience's attention. Ideal for business introductions and market and competitive analysis, it has an editing difficulty rated as 'easy' as users can easily replace text and data areas. This slide allows for impactful presentations.
Related Products
-
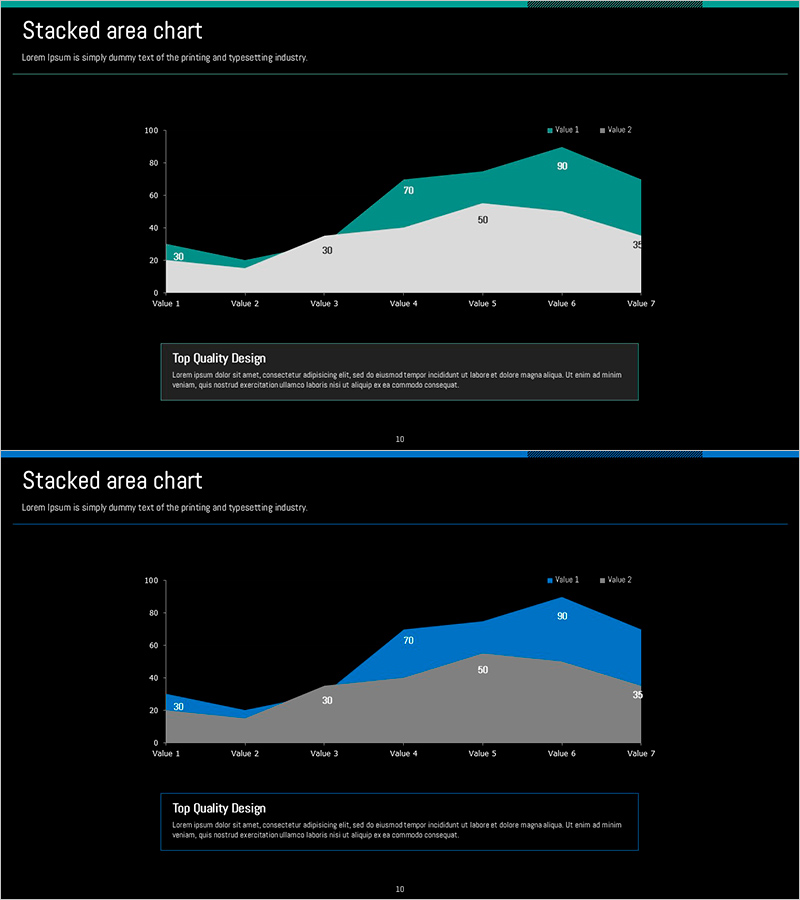
Green-Blue Regional Chart Analysis – Market Status and Competitor Analysis
#Market and Competitor Analysis #Graph #Other
-
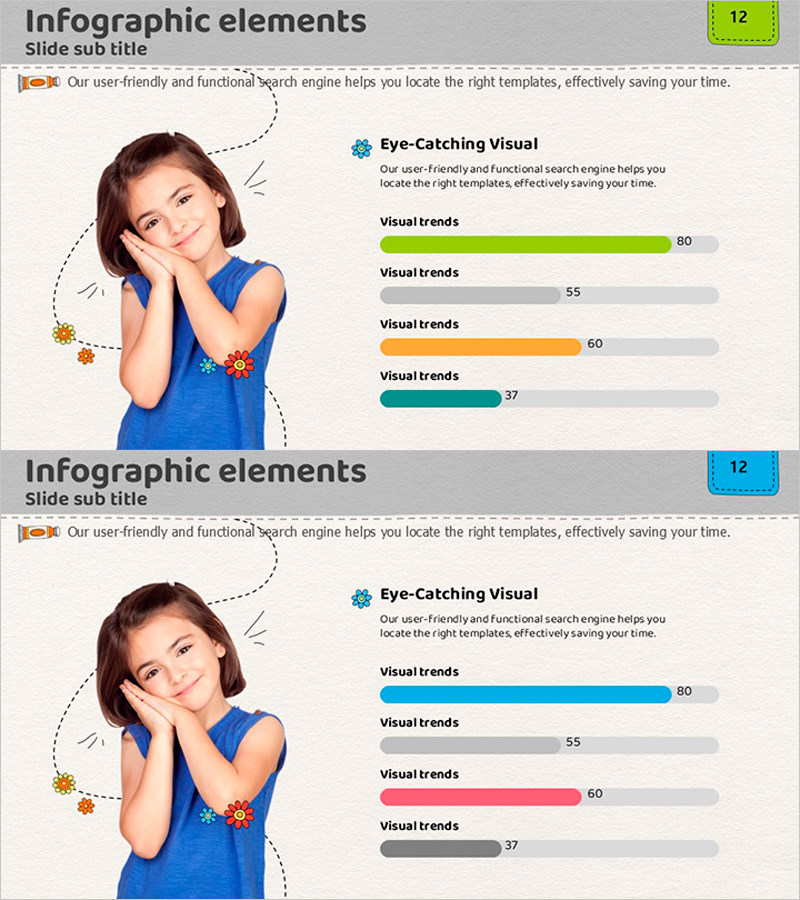
Children Detail Analysis Chart – Customer Insights and Success Stories
#Market and Competitor Analysis #Customer Success Stories #Graph
-
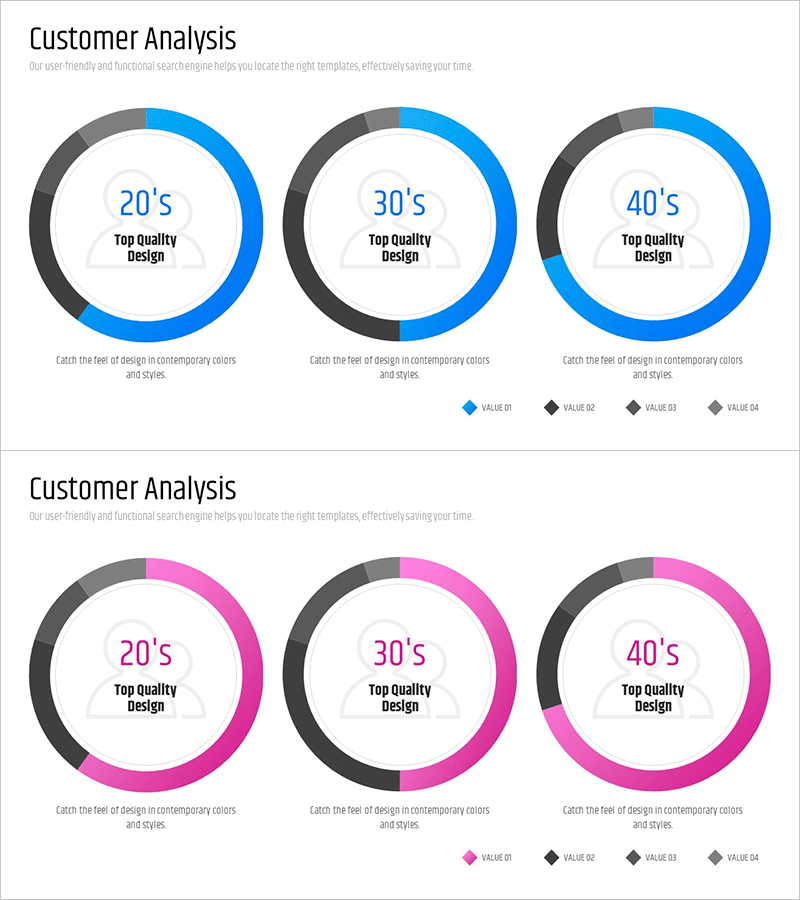
User Analysis by Age Donut Circle Graph
#Market and Competitor Analysis #Graph #Market Status
-
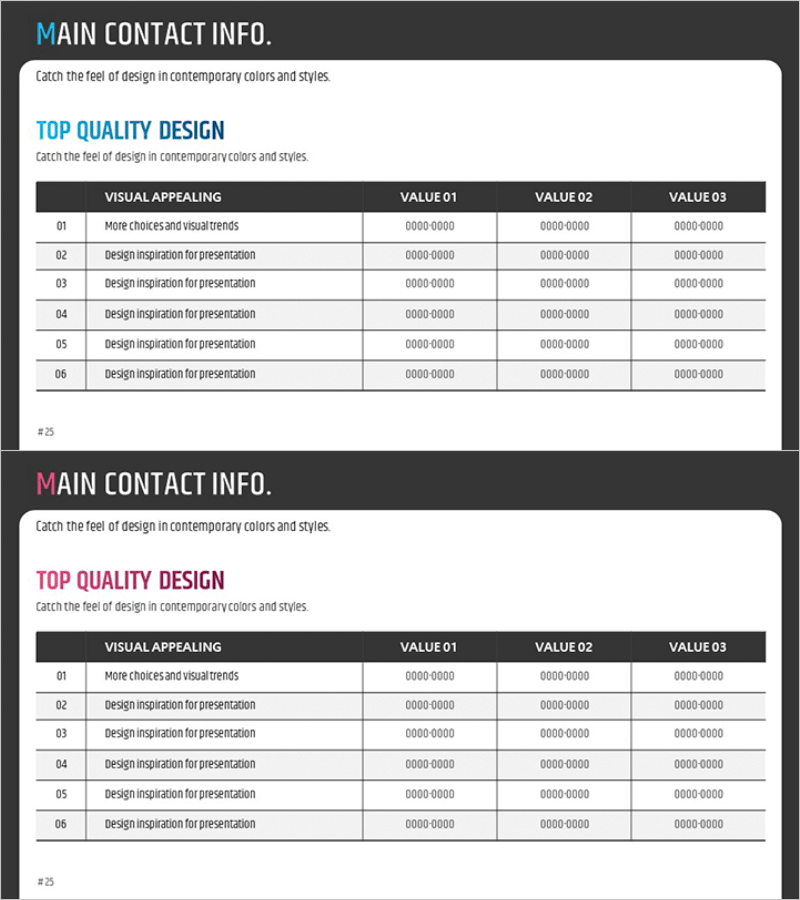
Table of Main Business Contacts – Trusted Business Network
#Company Introduction #Business Introduction #Business Vision and Strategy
