Business Introduction
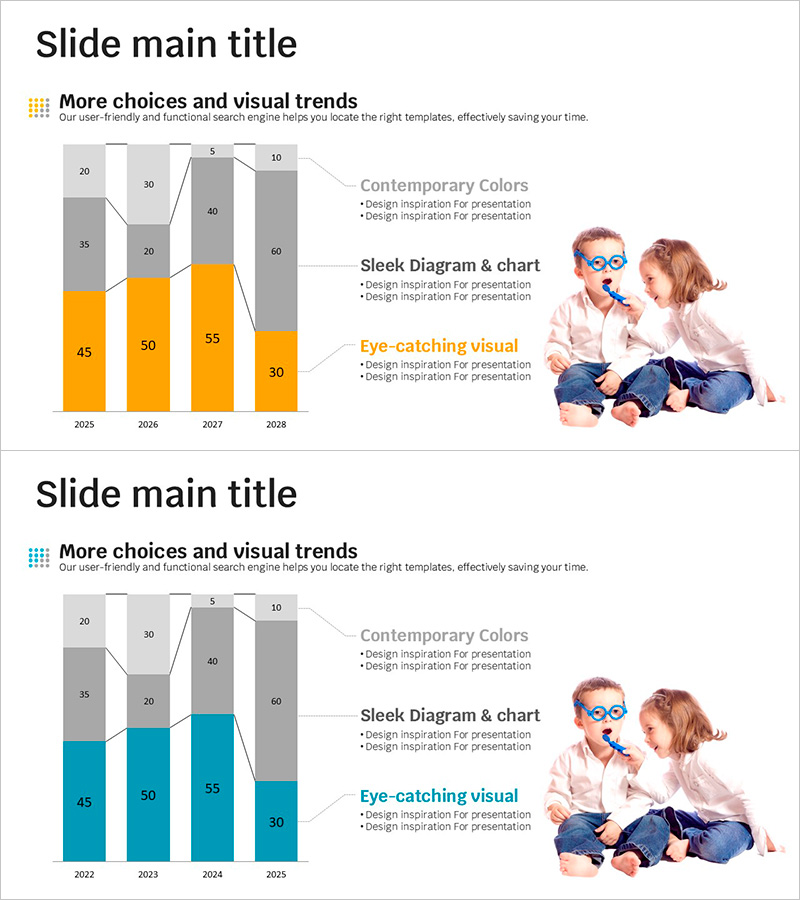
Analysis Graph for Child – Market Trends
RJ0500032_17
- Last Update 12/21/2025
- File Size 1.2MB
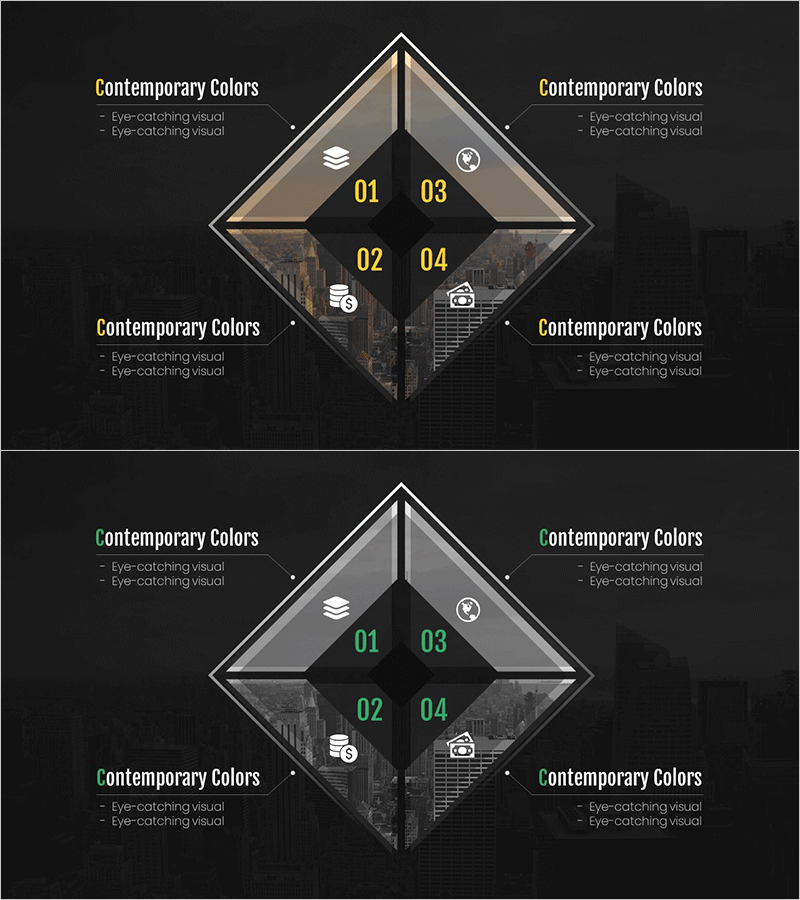
- # of Slides 2
- File Format PPTX
- Slide Ratio 16:9
- Color
Keywords
About the Product
This slide presents an analysis graph depicting market trends related to children. Utilizing horizontal and vertical bar formats, it effectively compares yearly data while maximizing visual impact with a yellow and blue color scheme. This graph, containing the theme of 'Child Analysis', is particularly suitable for explaining changes in the early childhood market. Structured to ensure clear data presentation, it's an asset in presentations from educational institutions or childcare-related businesses. The slide features an easy editing structure that allows for quick replacement of text and data, with an overall editing difficulty rated as easy.
Related Products
-
Closed Diffusion Diagram for Strategic Business Planning
#Business Introduction #Business Vision and Strategy #Diagram
-
Line Charts for Living Conditions – Visualizing Market Analysis
#Market and Competitor Analysis #Diagram #Graph
-
Year-by-Year Breakdown Comparison Analysis Graph
#Market and Competitor Analysis #Graph #Future Outlook
-
Financial Business Area Slide – Modern Diagram
#Company Introduction #Business Introduction #Diagram
