Business Promotion Strategy
Vertical Bar Graph Flow – Market and Performance Analysis
RJ0500016_9
- Last Update 12/21/2025
- File Size 0.5MB
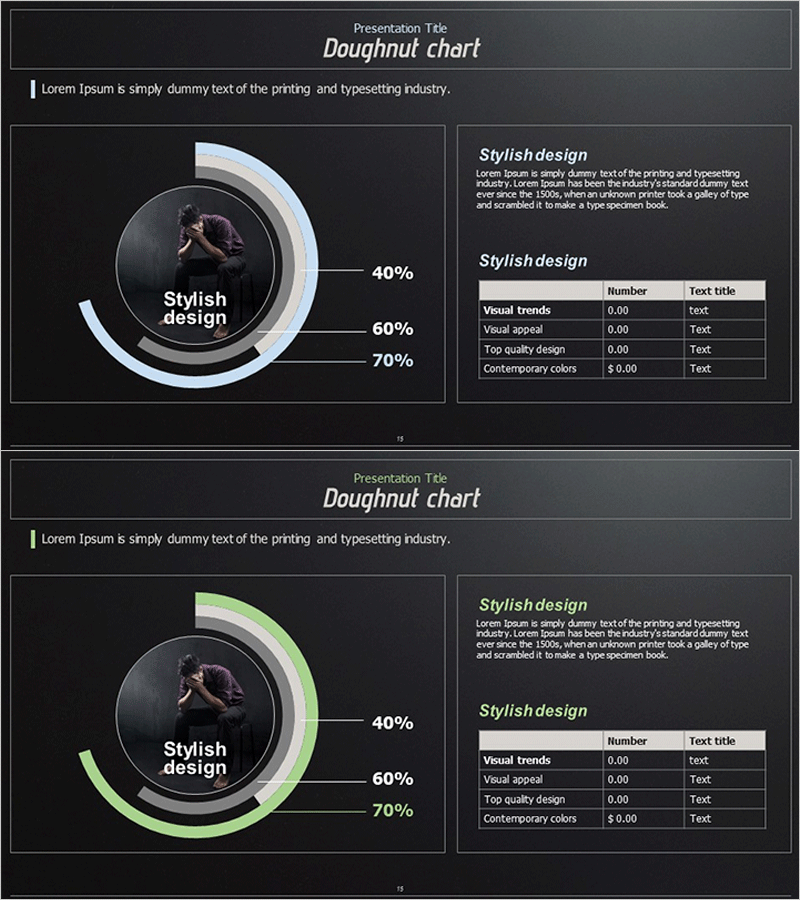
- # of Slides 2
- File Format PPTX
- Slide Ratio 16:9
- Color
Keywords
About the Product
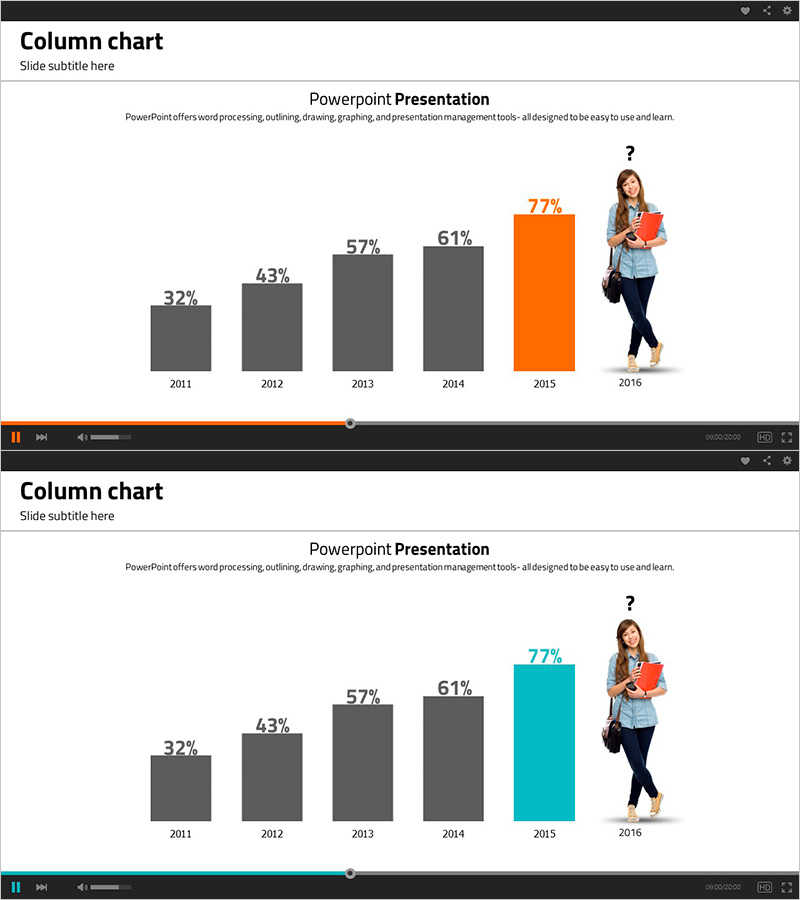
This slide effectively conveys market and competitive analysis results using a vertical bar graph. The contrast of yellow and green colors makes the design visually striking. It clearly presents future outlook through data, making it optimal for analyzing business performance and formulating strategies. The primary audience is business practitioners and executives, and editing difficulty is rated as 'easy' for quick modifications.
Related Products
-
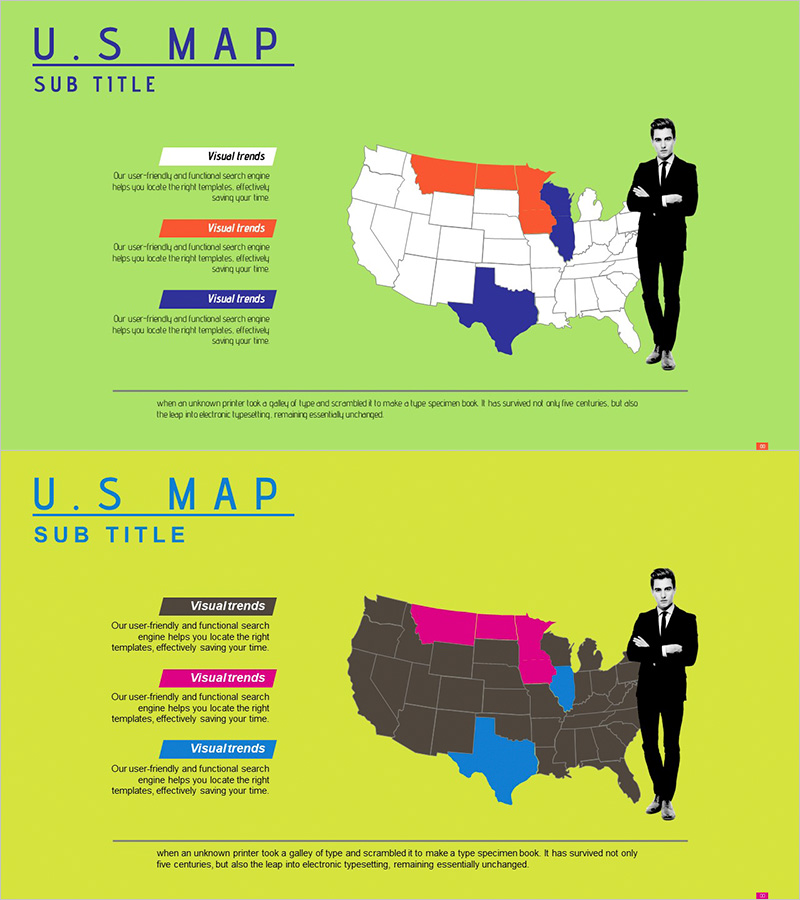
Setting Target Area Goals in the United States - Marketing Strategies and Insights
#Market and Competitor Analysis #Marketing Plan and Strategy #Other
-
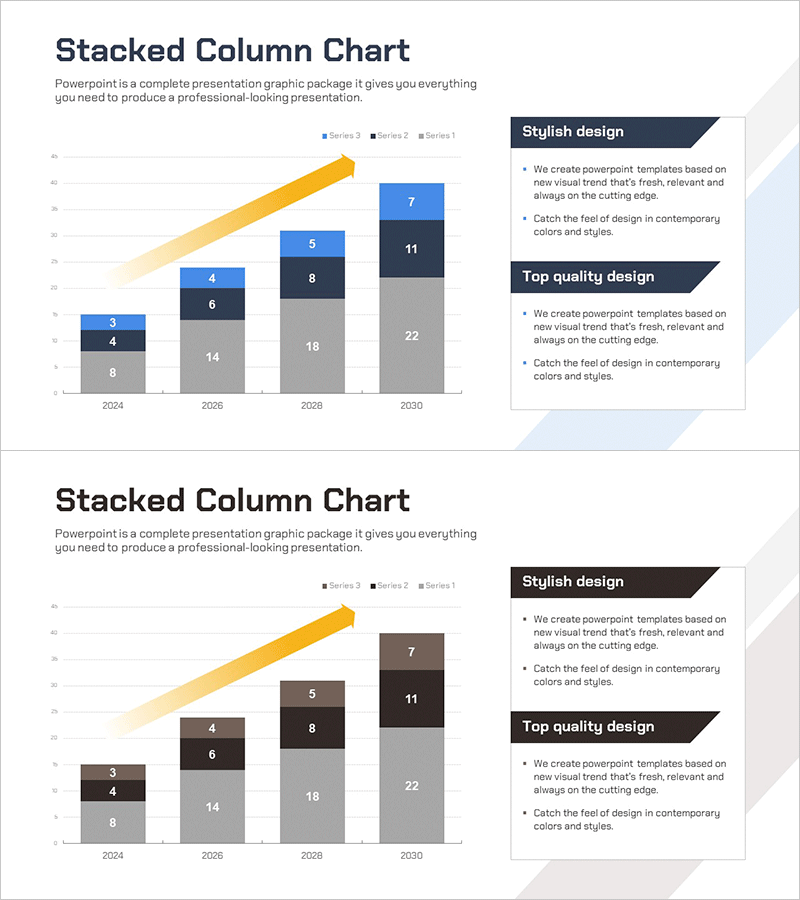
Year-by-Year Breakdown Comparison Analysis Graph
#Market and Competitor Analysis #Graph #Future Outlook
-
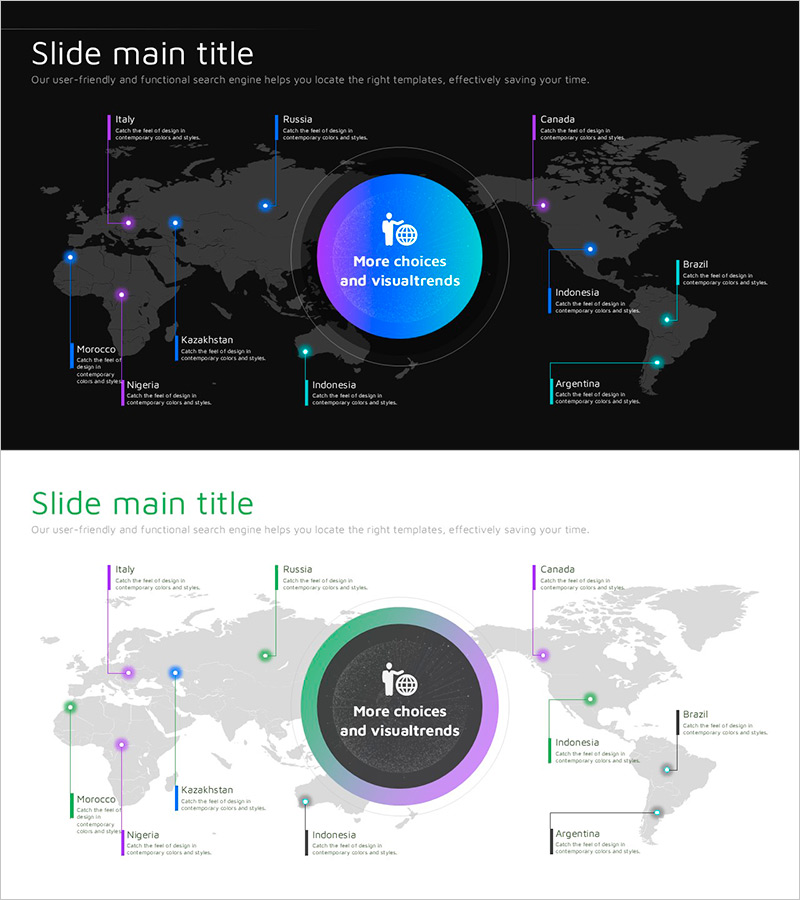
Infinite Energy Wide PPT Map – Global Network Analysis
#Company Introduction #Market and Competitor Analysis #Other
-
Drug Addiction Risk Analysis Graph Chart – Insightful Information Delivery
#Market and Competitor Analysis #Diagram #Graph
