Financial Plans and Performance
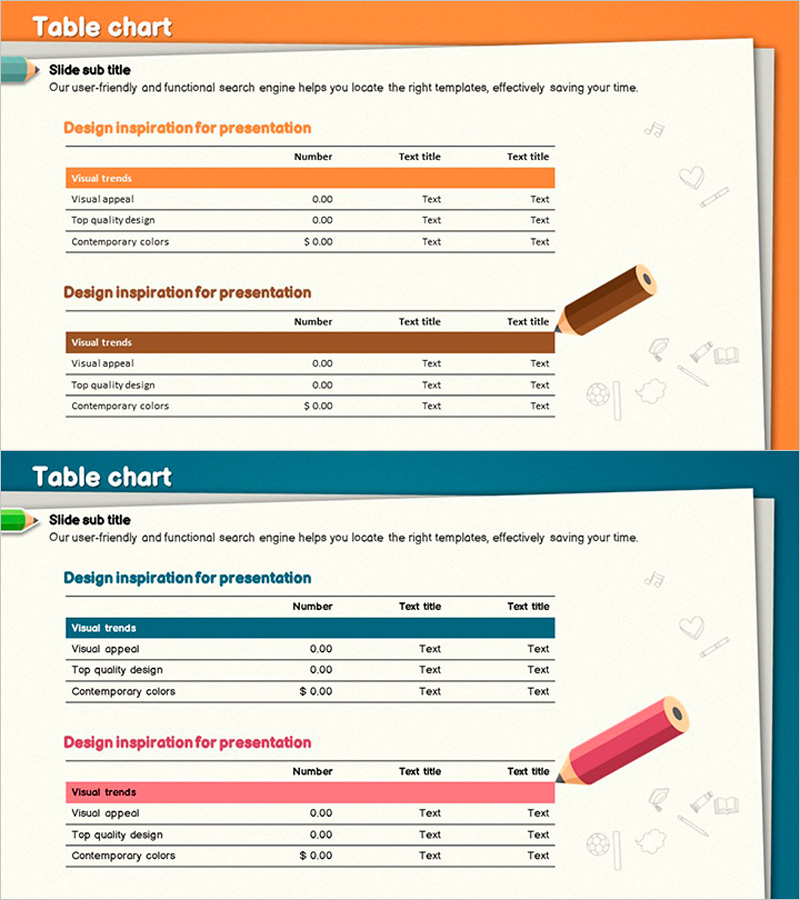
Colored Pencil Highlight Table Chart – Visualizing Financial Performance
RJ0500015_15
- Last Update 12/21/2025
- File Size 5.7MB
- # of Slides 2
- File Format PPTX
- Slide Ratio 16:9
- Color
Keywords
About the Product
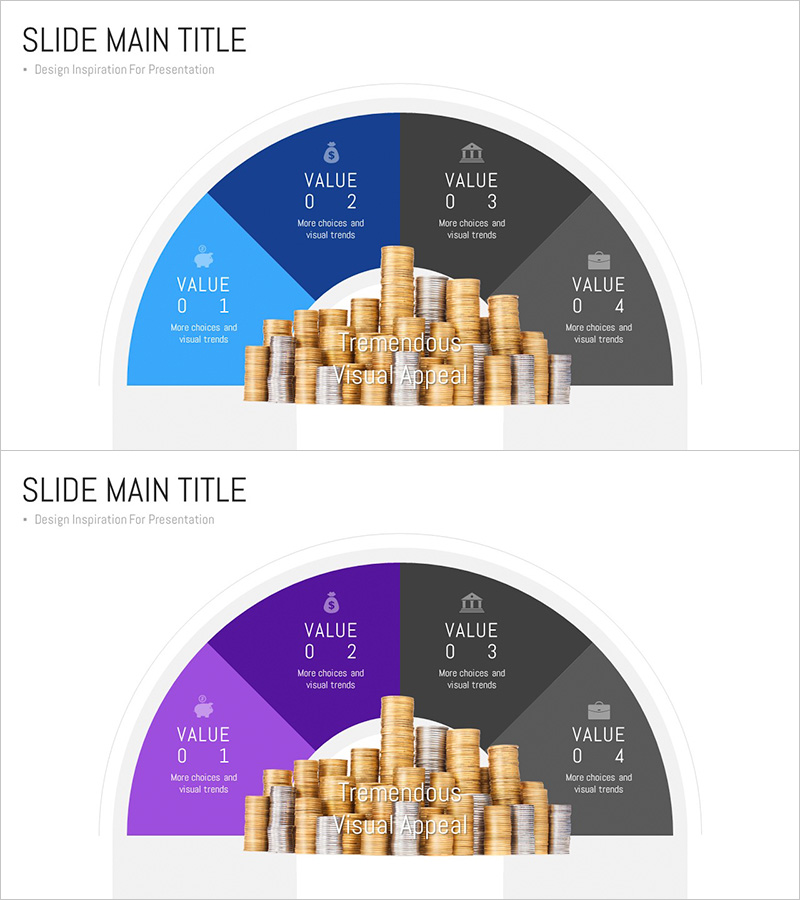
This slide features a table chart with colored pencil highlights. The visually appealing structure uses orange and teal colors harmoniously to convey the topic clearly. Focused on analyzing financial planning and performance, this slide is ideal for presenting balance sheets or revenue data effectively. Users will find an easy and convenient way to compare and communicate data through this presentation slide.
Related Products
-
Joint Business Development Status - Visualized Data with Cluster
#Company Introduction #Product/Service #Diagram
-
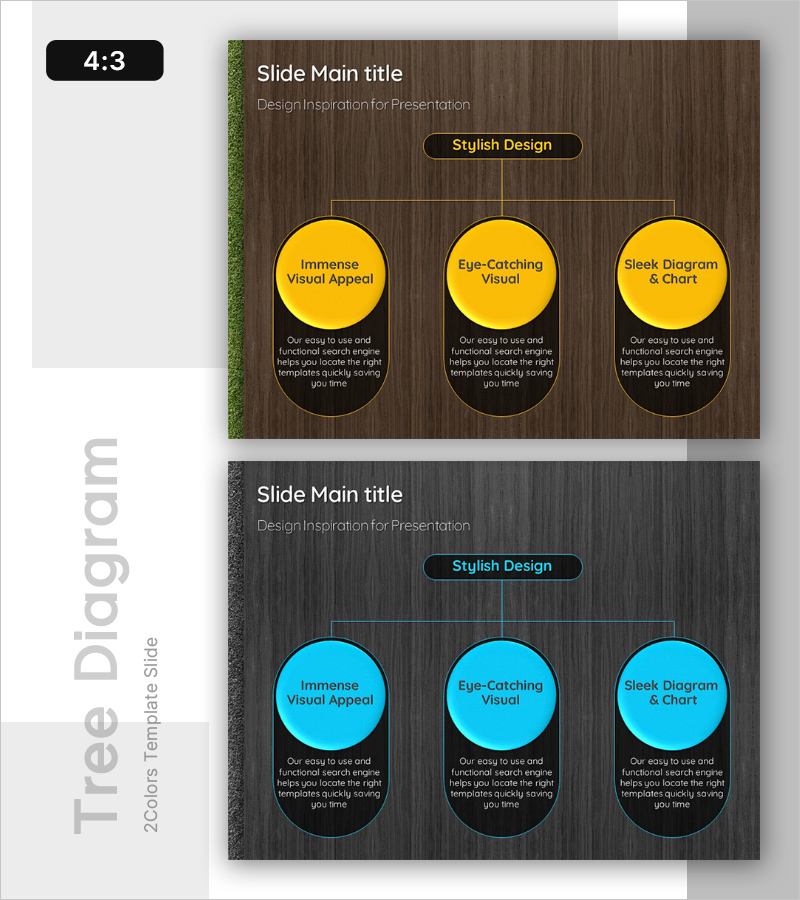
Tree Structure in Natural Background – System Diagram
#Technology Sector #Diagram #Service Configuration
-
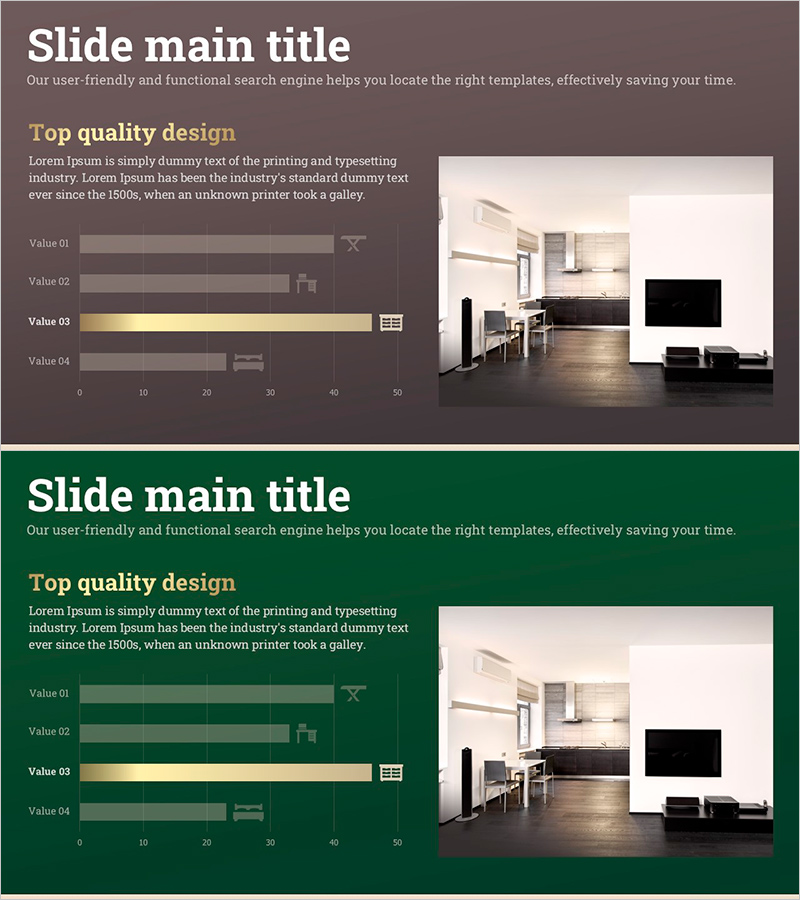
Furniture Sales Performance Graph – Business Strategy Achievement
#Business Promotion Strategy #Financial Plans and Performance #Graph
-
Bank Service Promotion Plan Diagram – Expansion Strategy for the Future
#Business Vision and Strategy #Business Management #Diagram
