Technology Sector
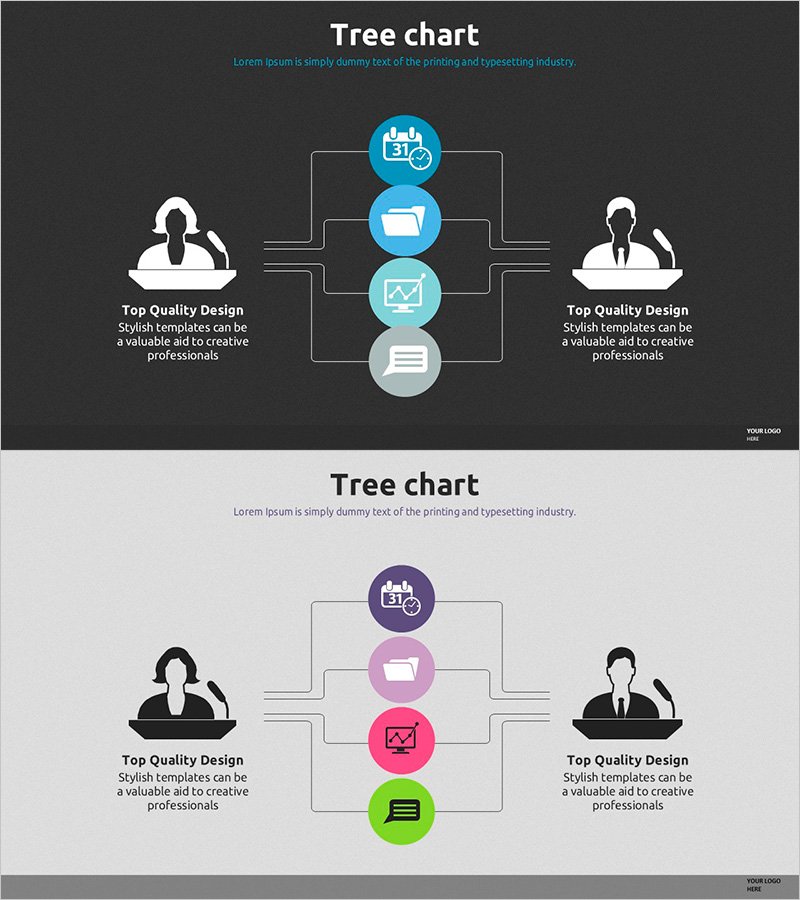
Visualizing Service Composition with Tree Structure System
RJ0500011_9
- Last Update 12/21/2025
- File Size 4.1MB
- # of Slides 2
- File Format PPTX
- Slide Ratio 16:9
- Color
Keywords
About the Product
This slide utilizes a tree structure diagram to intuitively visualize service composition and system architecture. The harmonious blend of blue and purple conveys stability and professionalism while effectively presenting various sub-services or processes. Targeted at professionals, it can be highly useful for explaining the hierarchical relationships or interactions of specific services. The editing difficulty is rated as 'easy', allowing for quick replacements of text and icons for immediate use.
Related Products
-
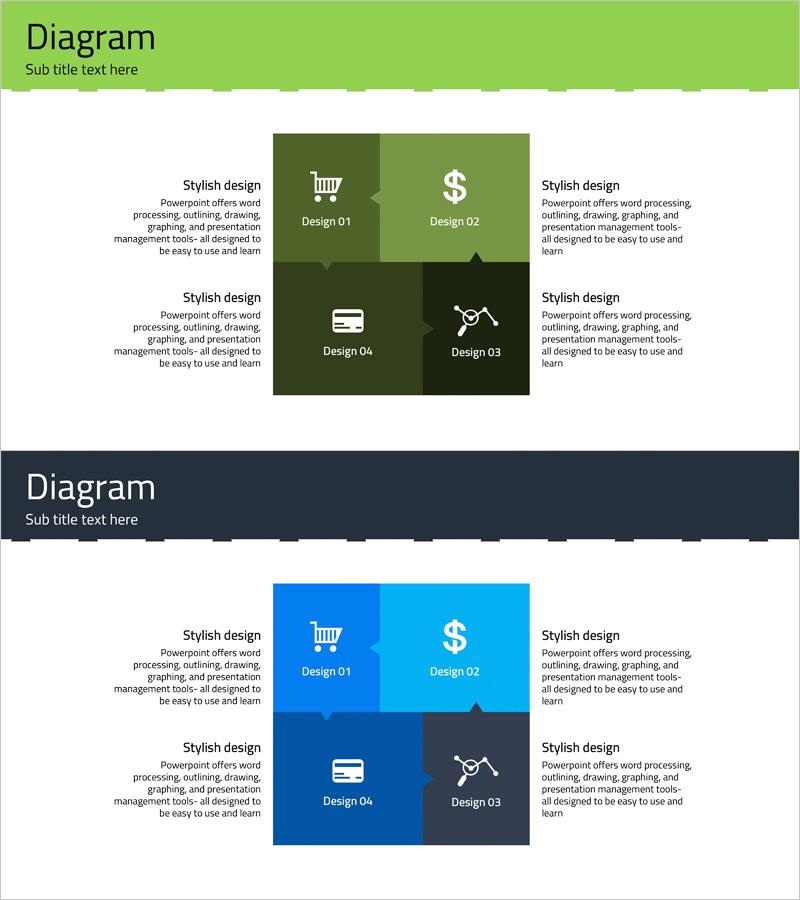
Diagram Slide for Visualizing Business Area and Understanding
#Business Introduction #Diagram #Business Areas
-

Joint Business Development Status - Visualized Data with Cluster
#Company Introduction #Product/Service #Diagram
-
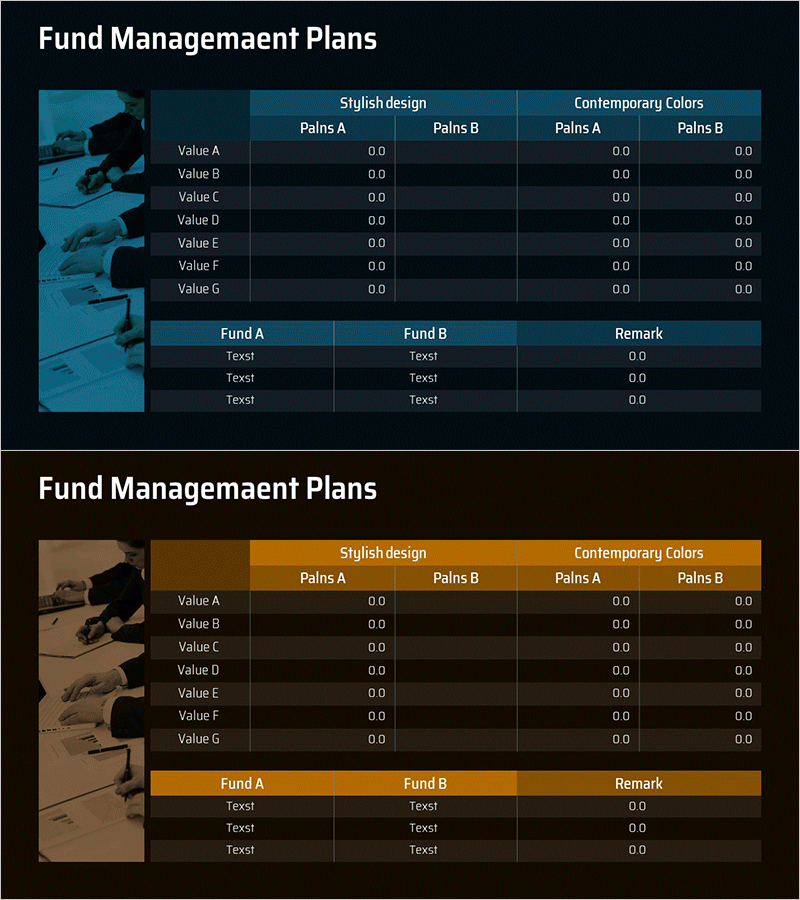
Funding Plan Table – Efficient Fund Management
#Marketing Plan and Strategy #Financial Plans and Performance #Diagram
-

Slide Showcasing Design Inspiration for Presentation – Contemporary Colors and Quality
#Business Promotion Strategy #Financial Plans and Performance #Diagram
