Funding Plan Table – Efficient Fund Management
RM0600007_23
- Last Update 02/25/2025
- File Size 0.7MB
- # of Slides 2
- File Format PPTX
- Slide Ratio 16:9
- Color
Keywords
- #Content-Based Slides
- #Design-Based Slides
- #Marketing Plan and Strategy
- #Financial Plans and Performance
- #Diagram
- #Pricing Strategy
- #Capital Requirements
- #Table
- #16:9
- #funding plan table PowerPoint slide
- #financial comparison slide
- #dual-fund presentation template
- #budget allocation PPT
- #investment data visualization
About the Product
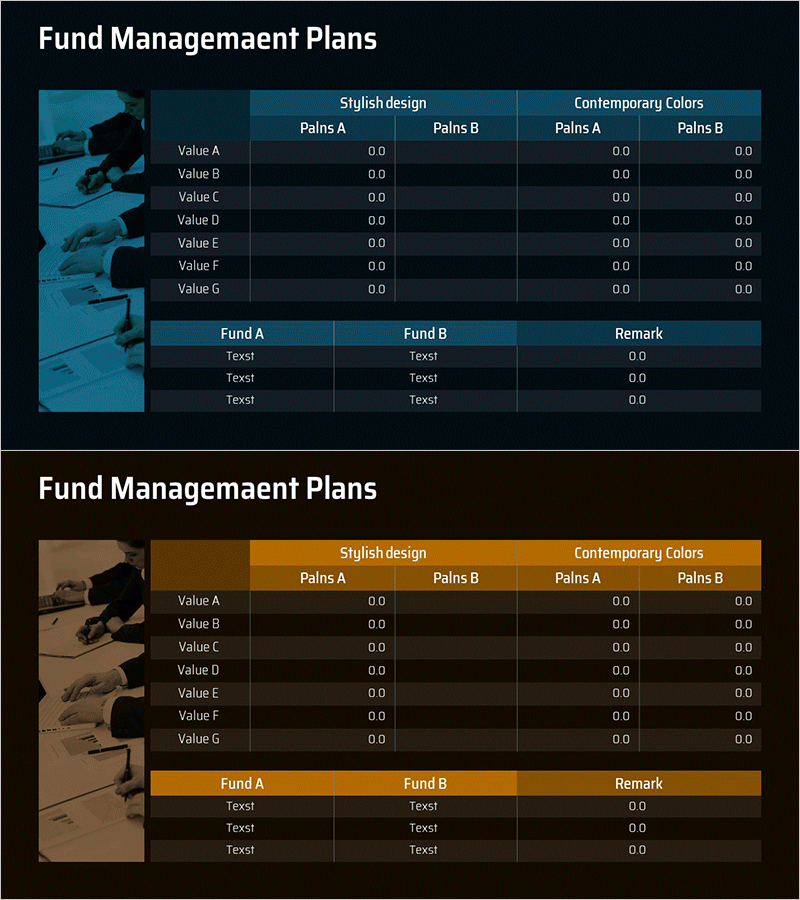
A financial data presentation slide designed for comparing fund allocation and budget scenarios across multiple parameters. This PowerPoint slide features two color variants—teal and gold headers on dark backgrounds—with a left-side image area and a right-side multi-table structure. The upper table displays seven value categories (Value A through G) compared across two funds (Fund A and Fund B) in both stylish design and contemporary color palettes. The lower section provides three rows of text input fields for fund descriptions and remarks. Delivered as a 16:9 widescreen PPTX file ready for immediate editing, this slide is ideal for investment presentations, financial reports, and fund management briefings.
Usage Points
-
Main Usage
Present and compare financial metrics, fund allocations, or budget scenarios across two funds or strategic options. The structured table layout enables clear side-by-side comparison of seven value categories, supporting data-driven decision-making in investment and financial planning contexts.
-
How to Use
Enter fund category names (Value A–G) in the left column and corresponding numerical values for each fund in the Palns A and B columns. Use the lower Fund A and Fund B sections to describe each fund's characteristics or strategy, and add supplementary notes in the Remark column. Select the color variant that best matches your presentation theme.
-
Recommended For
CFOs, financial analysts, investment managers, fund managers, and business executives presenting fund allocation strategies, investment return comparisons, budget scenarios, and financial planning initiatives.
-
Slide Structure
Two-column layout with image area (approximately 30% left) and table area (approximately 70% right). Upper table: 7 rows (Value A–G) × 4 columns (Palns A·B, Contemporary Colors Palns A·B). Lower table: 3 rows × 3 columns (Fund A, Fund B, Remark).
Related Products
-

Detailed Graph of Fund Management Analysis – Emphasis on Financial Performance
#Marketing Plan and Strategy #Financial Plans and Performance #Diagram
-

Fund Management Plan – A New Vision for Finance
#Marketing Plan and Strategy #Financial Plans and Performance #Diagram
-

Fund Management Plan Table Chart – Essential Slide for Financial Performance Analysis
#Marketing Plan and Strategy #Financial Plans and Performance #Diagram
-

Fund Management Calculation Table – Visualizing Financial Plans
#Marketing Plan and Strategy #Financial Plans and Performance #Diagram
