Technology Sector
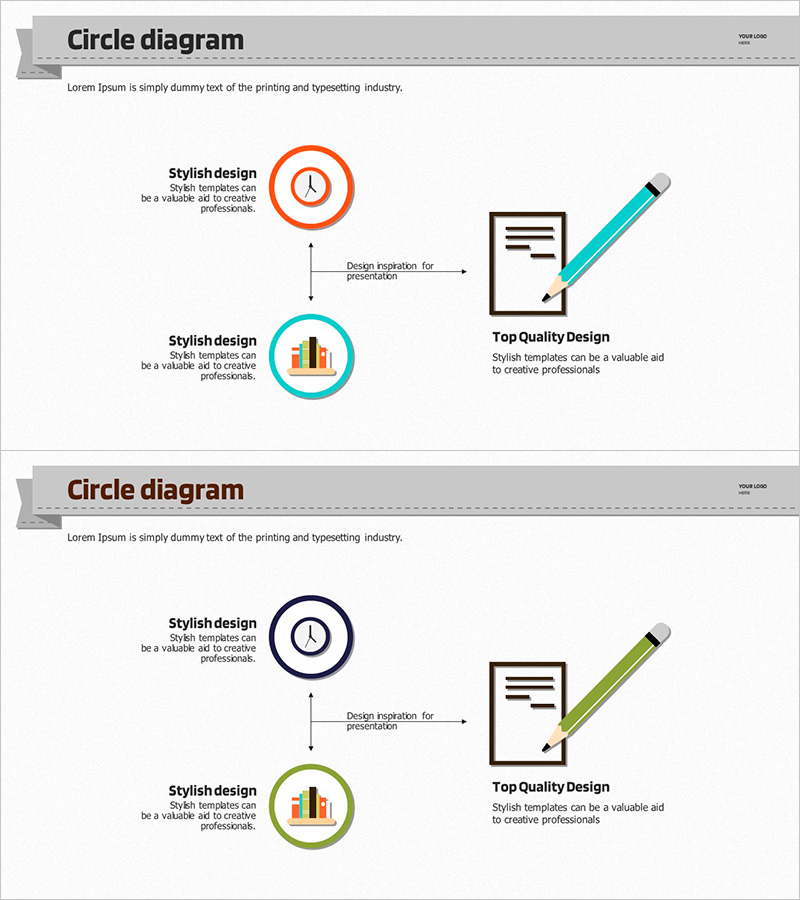
Diagram for Education-Related Measures
RJ0500007_28
- Last Update 12/21/2025
- File Size 1.2MB
- # of Slides 2
- File Format PPTX
- Slide Ratio 16:9
- Color
Keywords
About the Product
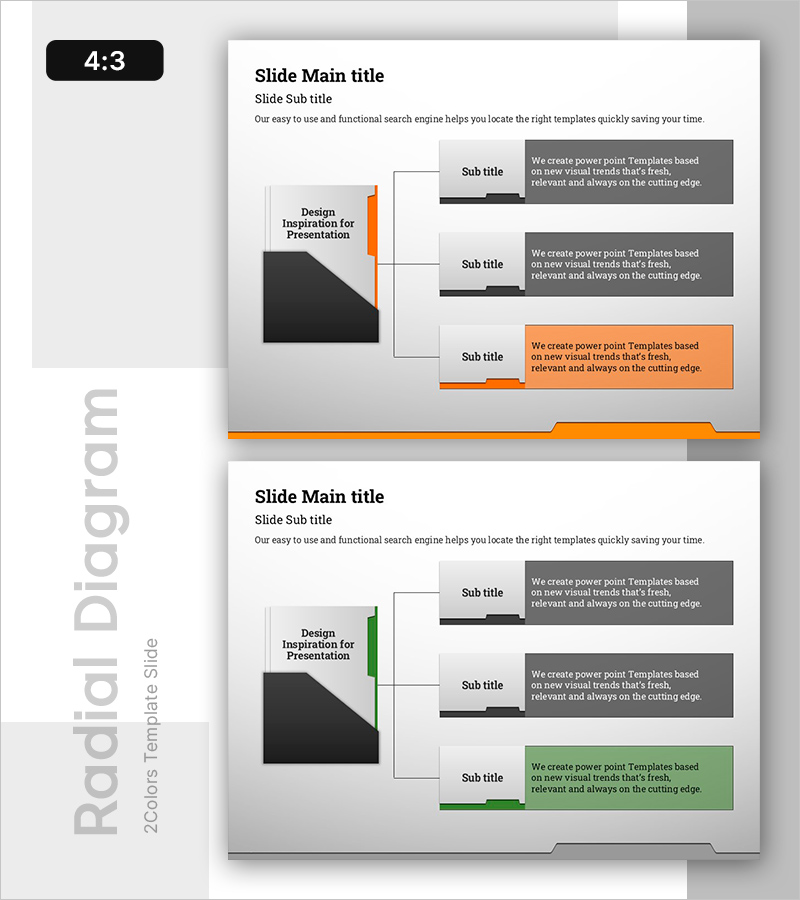
This slide features a diagram that effectively visualizes education-related measures. The symbolic circular structure and playful icons in vibrant orange and green tones enhance audience engagement. It is especially suited for conveying information related to technical sectors and service operations, making it ideal for educational materials, team meetings, and consulting presentations. Users can easily replace and adjust information due to the intuitive layout, with an overall editing difficulty rated as 'easy'.
Related Products
-
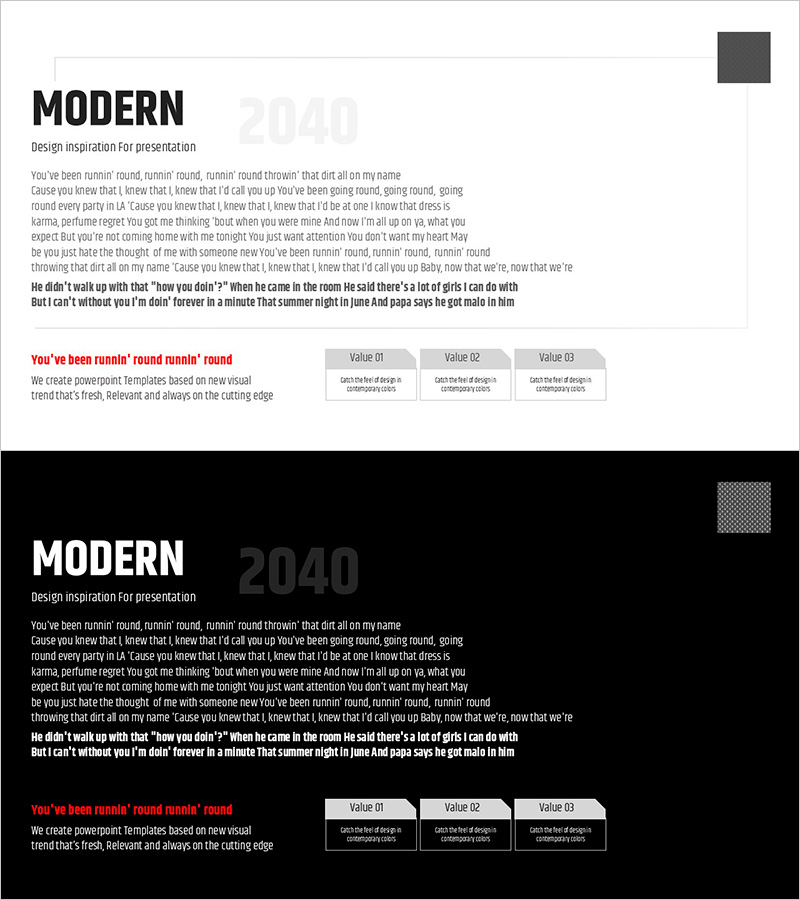
Modern Wide Template Text for Business Vision and Strategy
#Business Vision and Strategy #Technology Sector #Business Vision
-
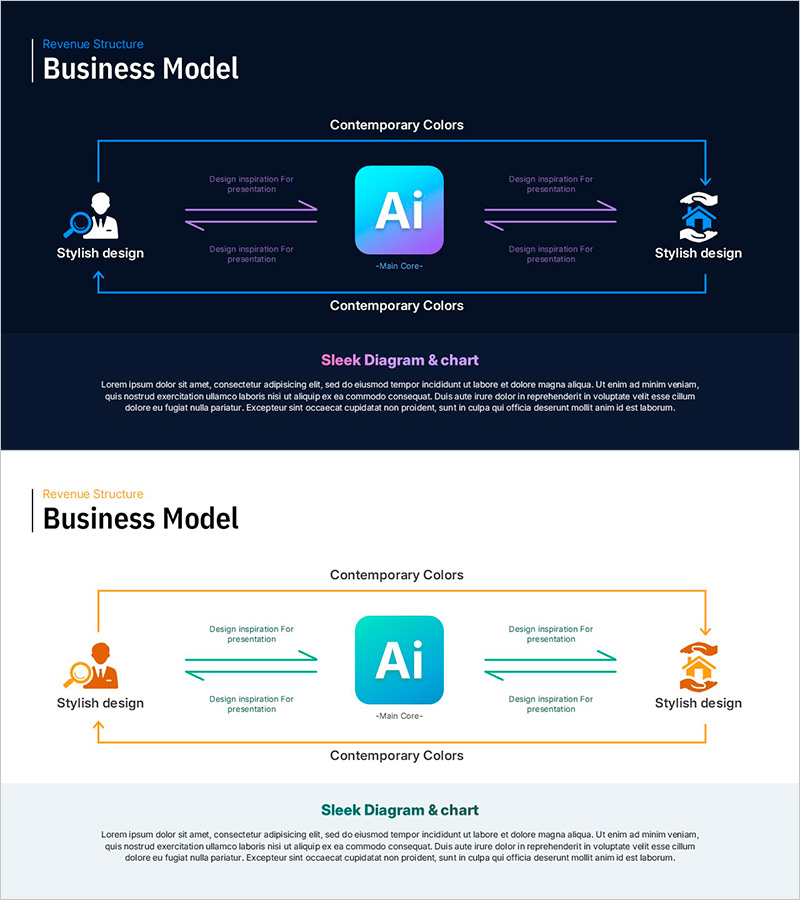
AI Business Model Structure Overview Diagram – Linear and Multidirectional Flow
#Business Introduction #Technology Sector #Diagram
-
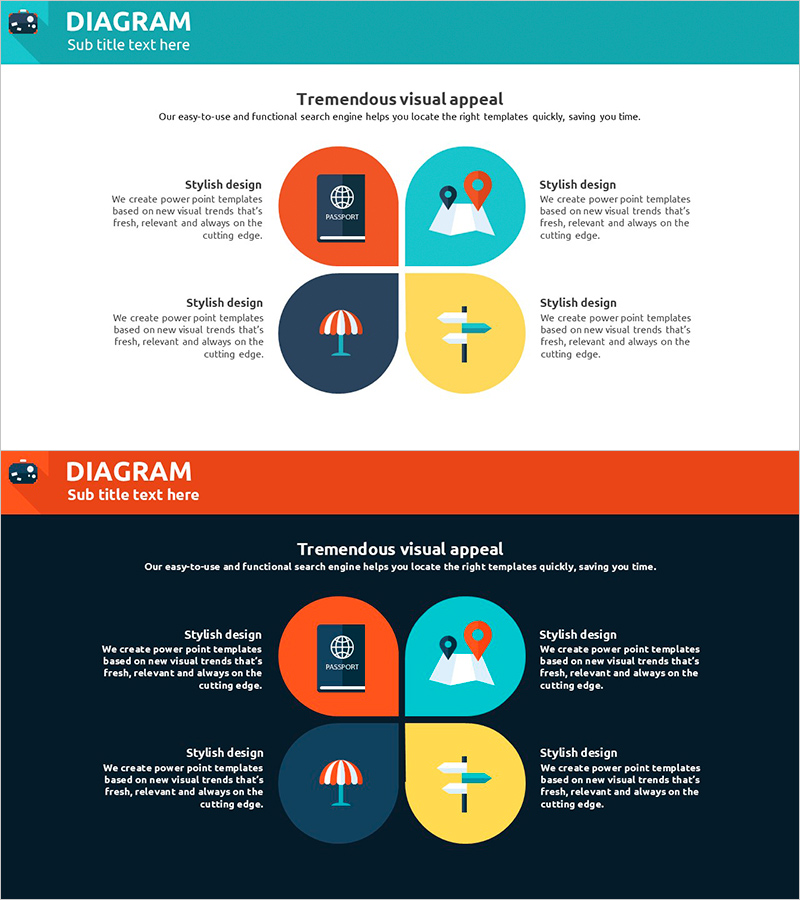
Diffusion Diagram of Overseas Travel Plans
#Business Management #Technology Sector #Diagram
-
Mapping Data Using Folders and Tree Structures – Technology Presentation
#Product/Service #Technology Sector #Diagram
