Mapping Data Using Folders and Tree Structures – Technology Presentation
RB0800029-1_23
- Last Update 03/24/2025
- File Size 0.4MB
- # of Slides 2
- File Format PPTX
- Slide Ratio 4:3
- Color
Keywords
- #Content-Based Slides
- #Design-Based Slides
- #Product/Service Introduction
- #Technical Approach
- #Diagram
- #Benefits and Advantages
- #Service Components
- #Cluster
- #Spread
- #Closed Cluster Diagram
- #4:3
- #closed-form diagram PowerPoint
- #hierarchical structure slide template
- #data mapping diagram
- #technical architecture PPT
- #3-level hierarchy PowerPoint slide
About the Product
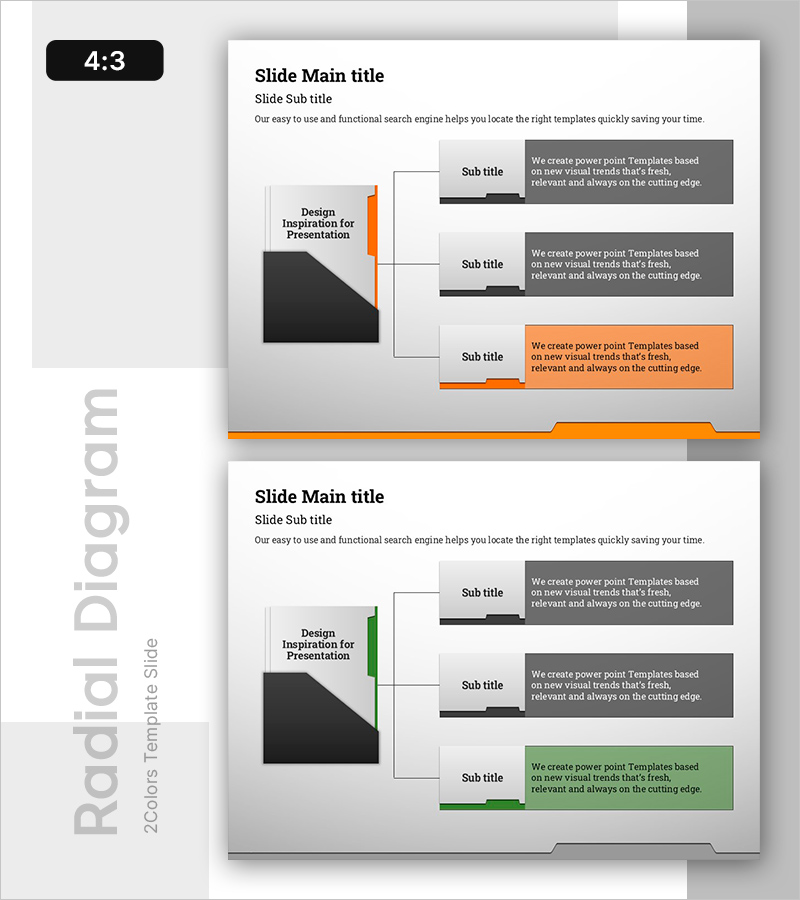
A closed-form diagram PowerPoint slide optimized for technology presentations. This design features a left-side image area connected to a right-side 3-level hierarchical structure using arrow-based connectors, ideal for visualizing data mapping, service architecture, and technical frameworks. The layout uses orange, black, and gray tones to distinguish information layers, with editable text boxes at each level for descriptions. Delivered in 4:3 aspect ratio across 2 slides, ready for immediate integration into your presentation workflow.
Usage Points
-
Main Usage
Visualize data flow, service layers, and technical architecture in technology presentations using a 3-level hierarchical structure. The arrow-based layout connecting left-side imagery to right-side text boxes clarifies relationships between information elements, while color differentiation emphasizes each layer's role.
-
How to Use
Insert product images, diagrams, or screenshots in the left 'Design Inspiration' area, then populate the three right-side text boxes with layer-specific descriptions (features, capabilities, benefits). Maintain the orange, black, and gray color scheme or customize with your corporate brand colors for seamless presentation integration.
-
Recommended For
Recommended for technology teams, IT departments, and development professionals presenting technical explanations, product architecture overviews, service composition details, system integration proposals, and technical seminars. Ideal for B2B technology presentations requiring clear communication of data flow and hierarchical relationships.
-
Slide Structure
2-slide set. Each slide features a left image area (black background) connected to a right 3-level hierarchical structure (orange, black, and gray text boxes) via arrows. Each text box includes title and description fields for easy content input and customization.
Related Products
-

Integrated System for Strategy Execution – Product Differentiation Strategy
#Product/Service Introduction #Diagram #Differentiation Strategy for Products/Services
-

Systemic Connectivity in a Circular Model – Innovative Service Structure
#Business Vision and Strategy #Technical Approach #Diagram
-

Geoscience Target Strategy - Utilizing Cluster and Diffusion Diagrams
#Product/Service Introduction #Business Introduction #Diagram
-

Service System Diagram – Visualizing the Core Structure of Business
#Company Introduction #Product/Service Introduction #Diagram
