Financial Plans and Performance
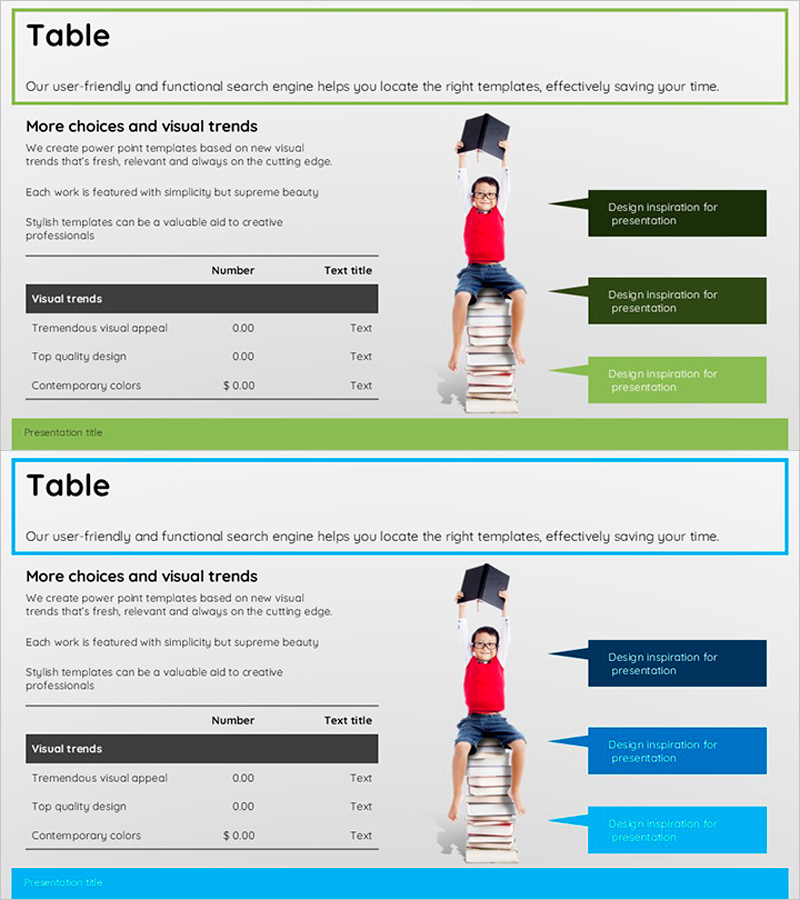
Key Messages and Table Chart Analysis – Data-Driven Success Strategies
RJ0500005_10
- Last Update 12/21/2025
- File Size 0.5MB
- # of Slides 2
- File Format PPTX
- Slide Ratio 16:9
- Color
Keywords
About the Product
This slide effectively communicates key messages while visually analyzing table charts related to customer success stories and financial plans. The design is simple yet highly functional, featuring a lively combination of green and blue to enhance engagement. The layout harmoniously integrates data with text boxes, allowing for a clear connection between past performance and future projections. This slide serves to help practitioners easily understand and intuitively analyze the information presented. The elements are easily replaceable, ensuring that the content can be efficiently updated as needed.
Related Products
-
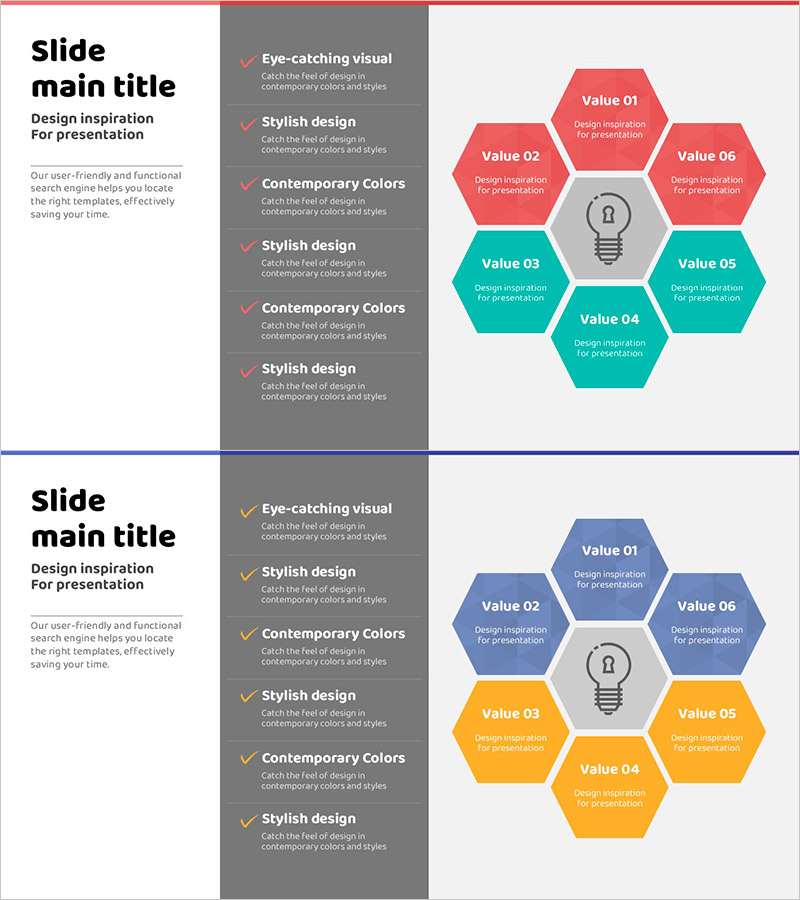
Creative Technology Hexagonal Diagram - Business Introduction and Technology Status
#Business Introduction #Technology Sector #Diagram
-
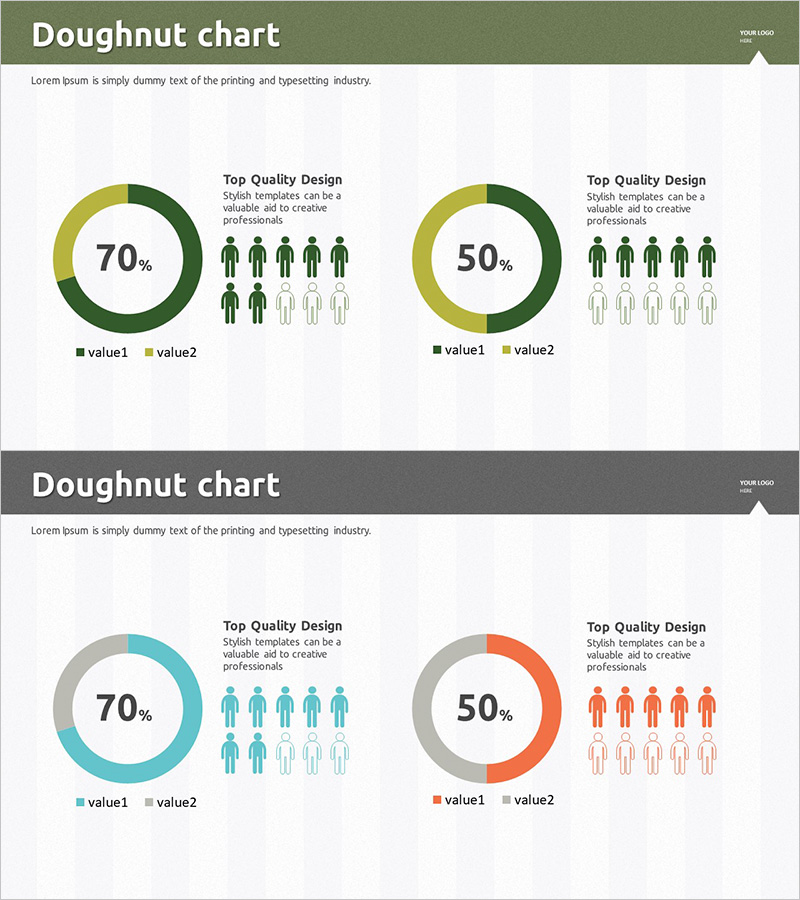
Customer Evaluation and Feedback on Renewable Energy Business - Doughnut Chart
#Market and Competitor Analysis #Customer Success Stories #Graph
-
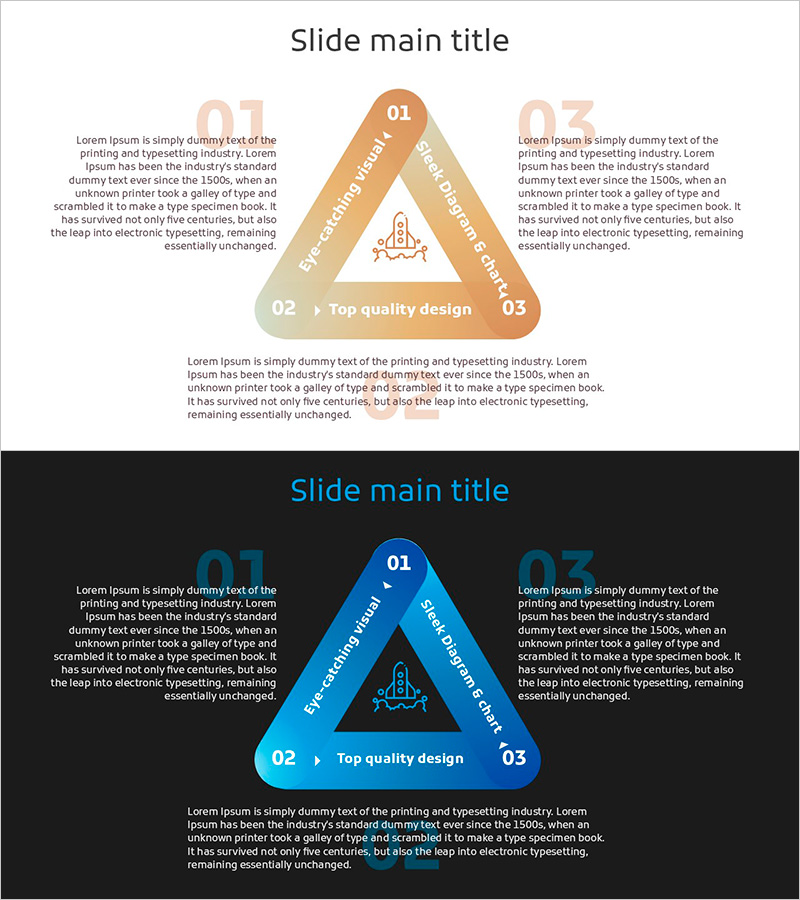
Dot Patterns Wide PowerPoint Template – Diagram for Business Strategy
#Business Promotion Strategy #Technology Sector #Diagram
-

Service Development Plan Strengths & Weaknesses
#Business Management #Technology Sector #Diagram
