Company Introduction
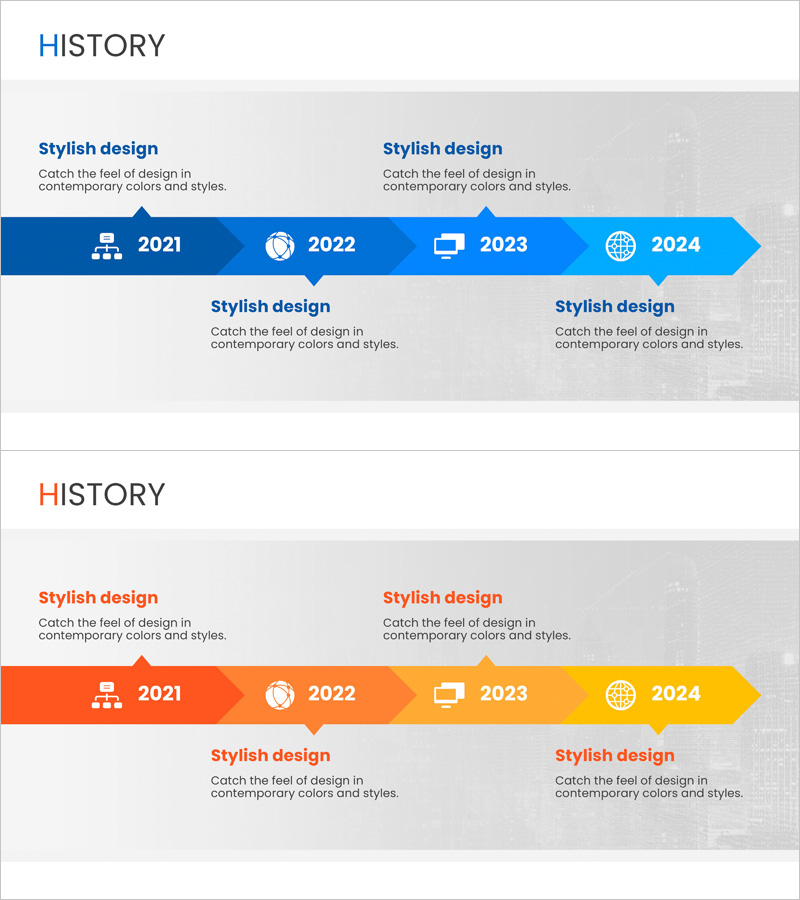
Social Media Linear Diagram – Stages of Business Growth
RJ0400070_21
- Last Update 12/21/2025
- File Size 0.4MB
- # of Slides 2
- File Format PPTX
- Slide Ratio 16:9
- Color
Keywords
About the Product
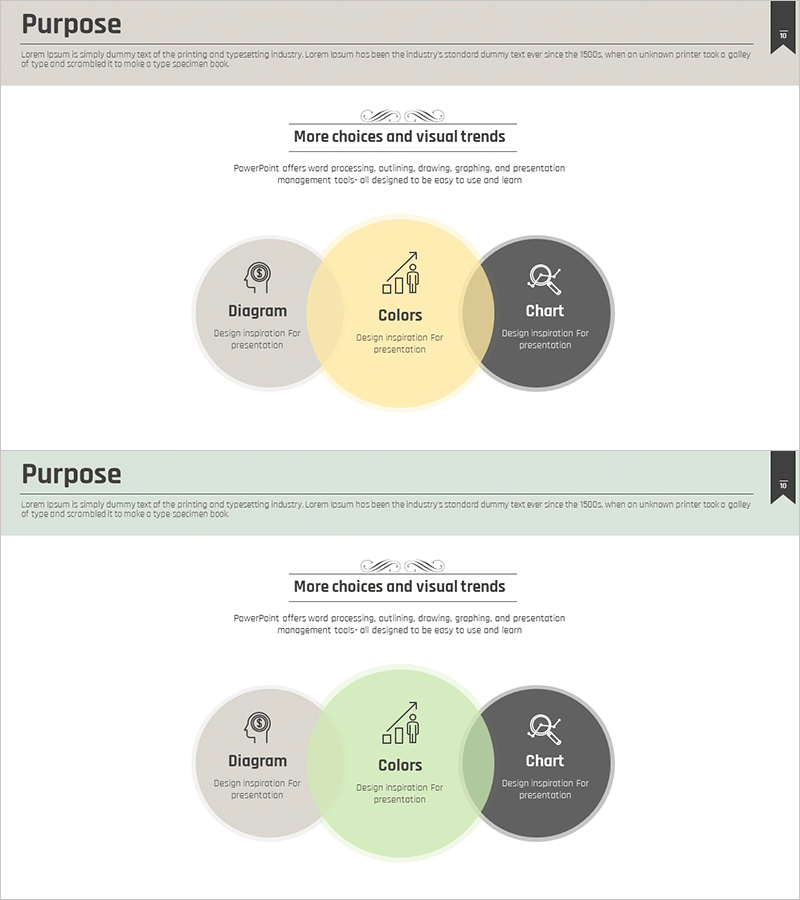
This slide presents the history of social media in a clear linear diagram. The contrast of blue and orange effectively conveys information, suitable for business presentations and marketing strategy meetings. This design highlights the timeline in stages, showcasing the growth of the company visually. The text and icon sections are easy to edit, with an overall editing difficulty rated as 'easy'.
Related Products
-
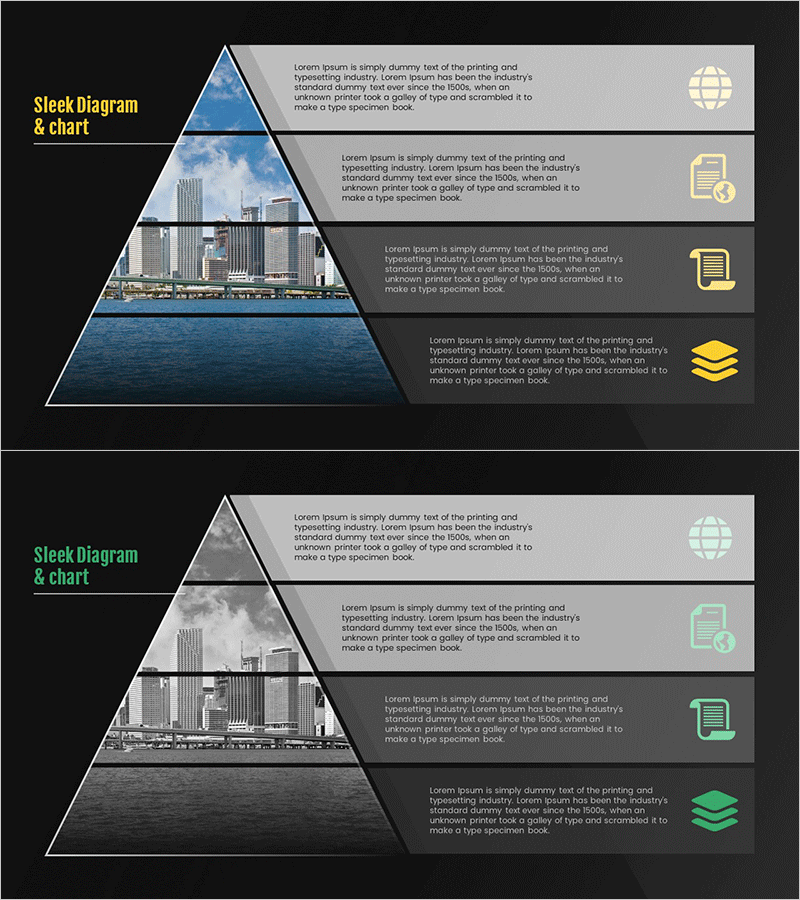
Service Composition Layer Diagram – Business Goals and Strategy
#Business Vision and Strategy #Technology Sector #Diagram
-
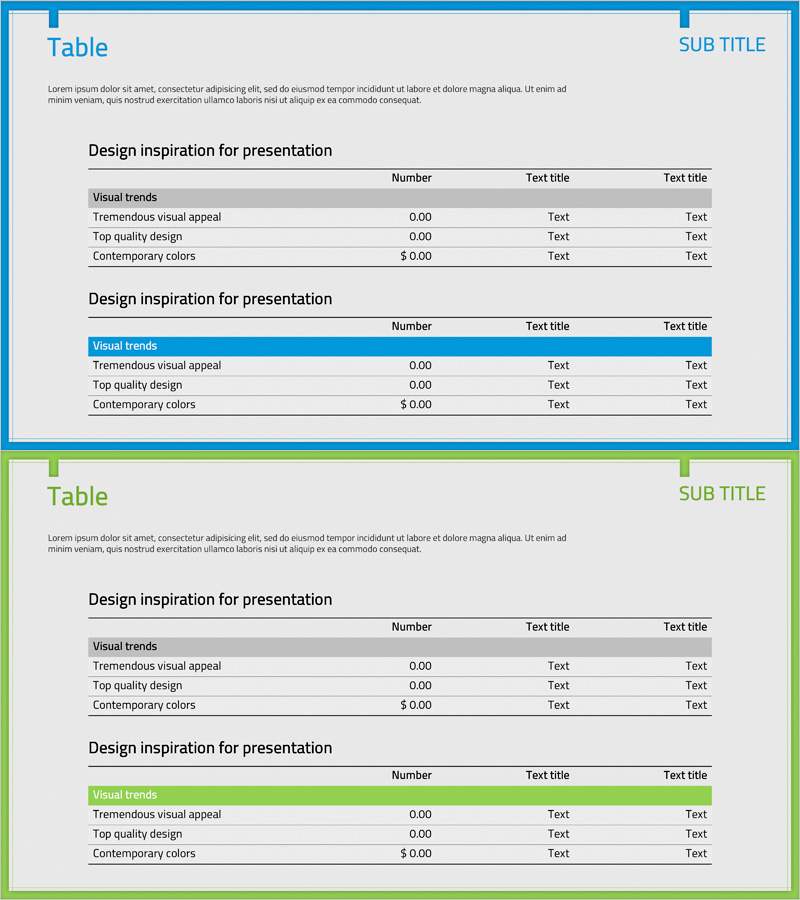
Sales and Profit Table Diagram
#Financial Plans and Performance #Diagram #Income Statement
-
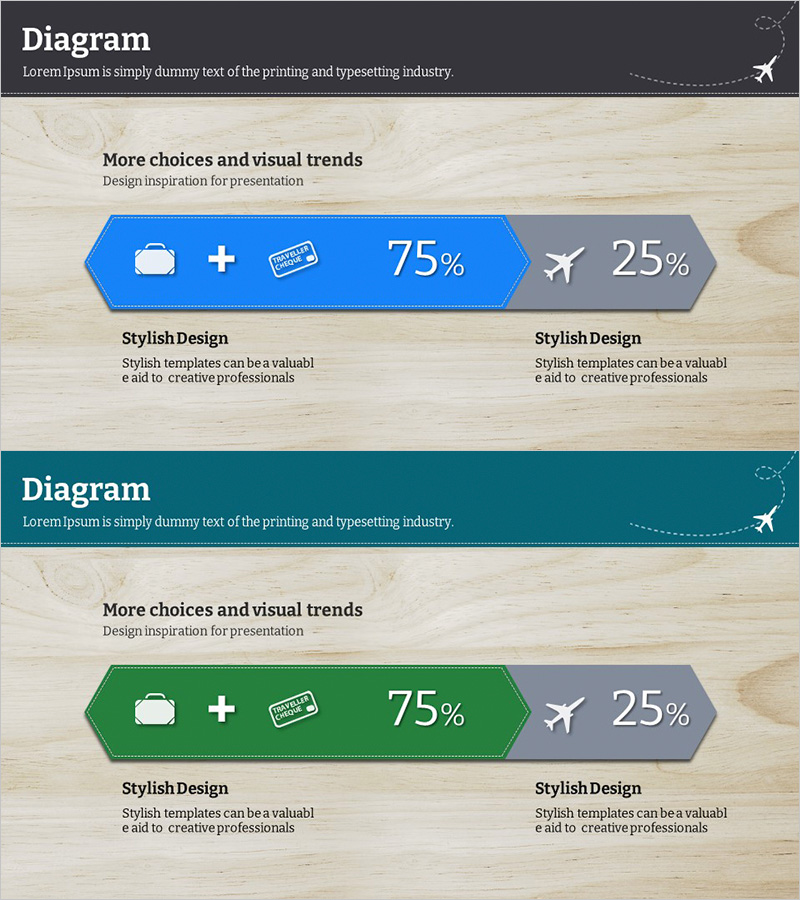
Projected Investment Returns Graph – Visualized in Blue Green Linear Flow
#Financial Plans and Performance #Diagram #Graph
-
Setting Core Business Goals – Strategic Approach
#Business Vision and Strategy #Marketing Plan and Strategy #Diagram
