Company Introduction
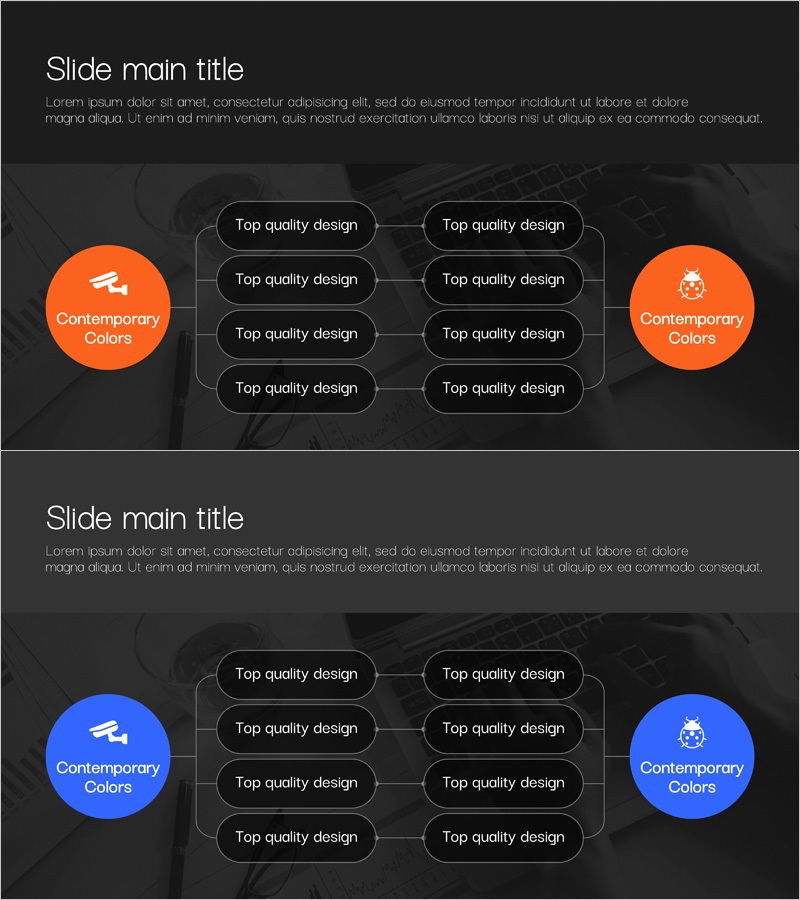
Business Relationship Diagram for Organizational Visualization – Effective System Structuring
RJ0400069_20
- Last Update 12/21/2025
- File Size 0.7MB
- # of Slides 2
- File Format PPTX
- Slide Ratio 16:9
- Color
Keywords
About the Product
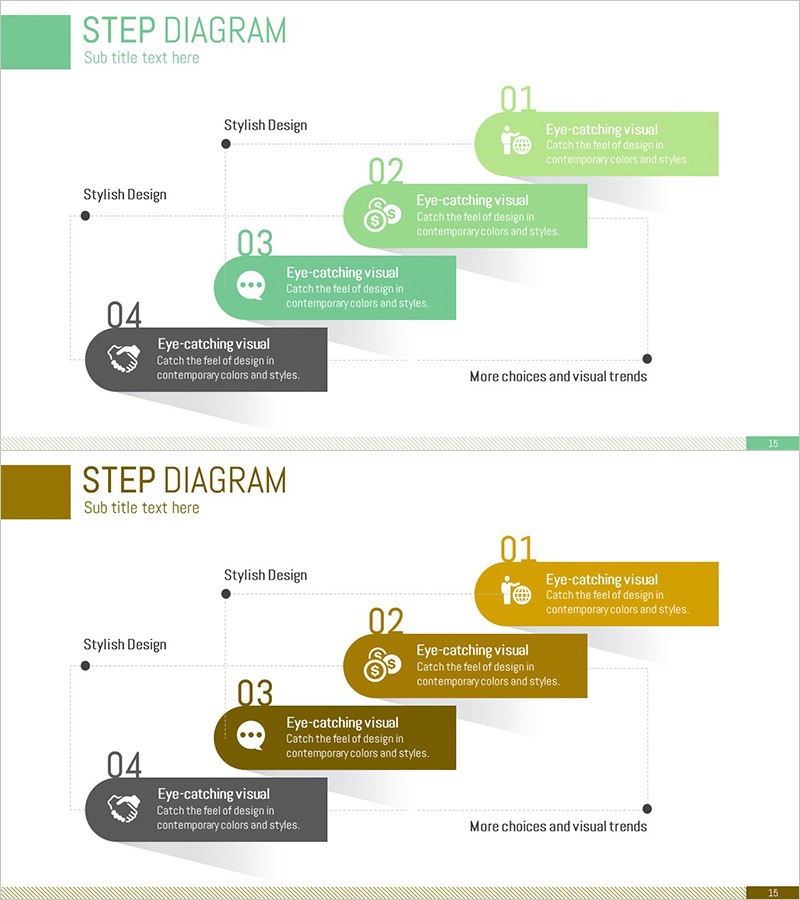
This slide optimally visualizes relationships within organizations through a Business Relationship Diagram. Two color tones, orange and blue, create a clear layout that college students and professionals can easily understand. This structure is ideal for explaining complex business relationships, such as in the technology sector and clusters, and effectively conveys corporate vision and system processes. Users can clearly present teamwork dynamics and information flow using this slide, which features easily replaceable elements like text, icons, and background images, ensuring high editing convenience. The editing difficulty is rated as average, making it readily applicable to various corporate presentations.
Related Products
-
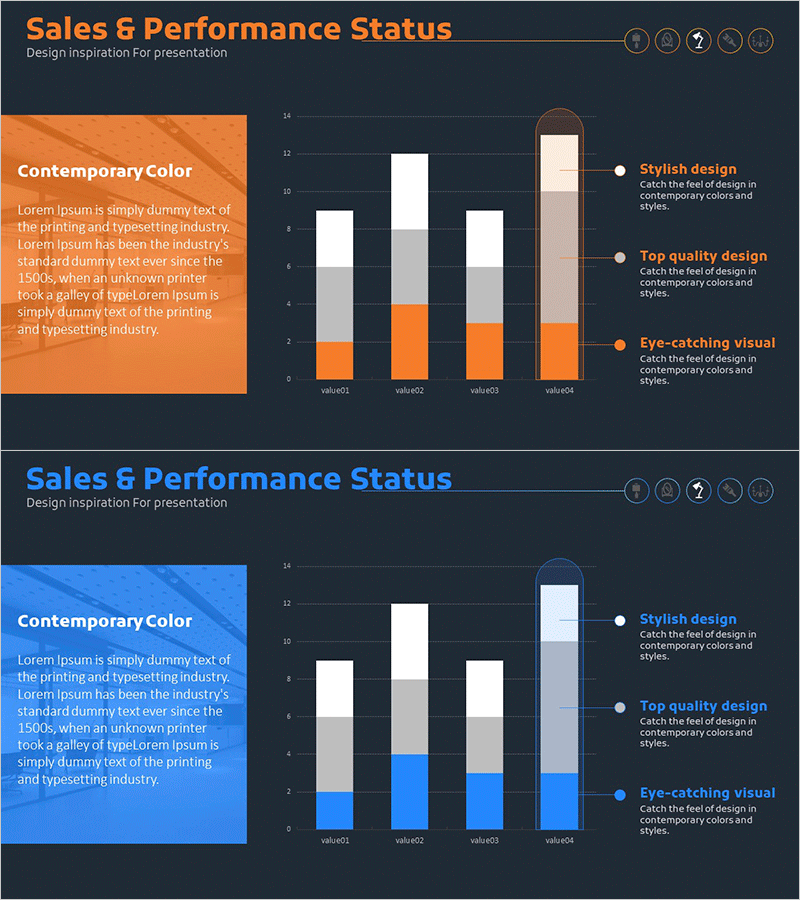
Market Segmentation Analysis Graph – Data-Driven Insights
#Company Introduction #Market and Competitor Analysis #Graph
-
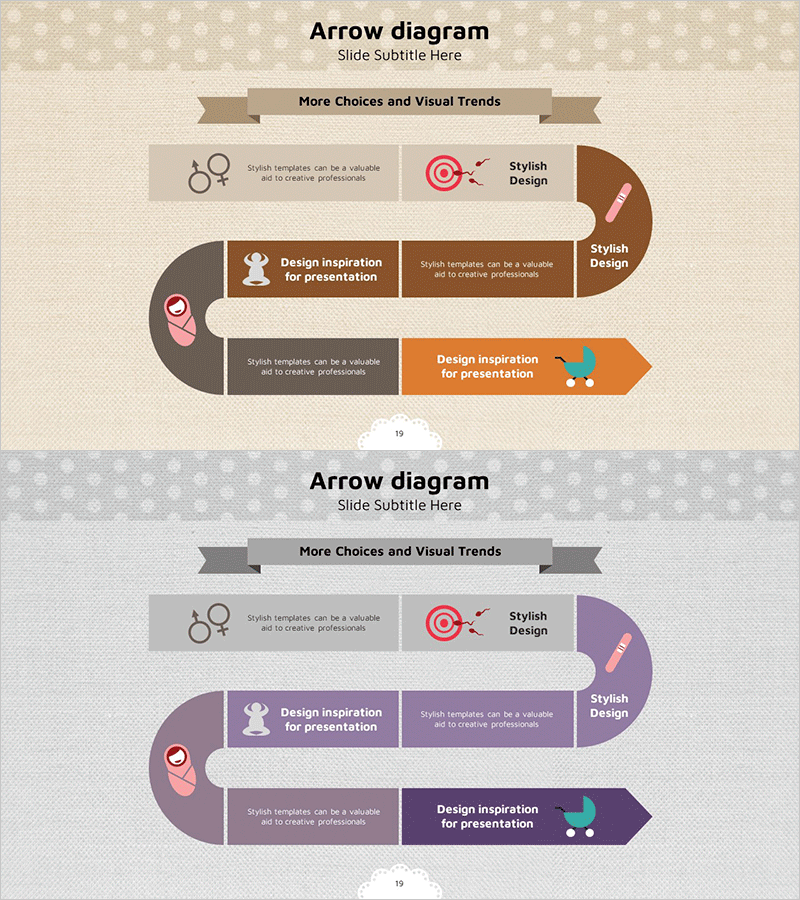
Diagram of Pregnancy and Childbirth Process – Operational Planning
#Business Promotion Strategy #Operation Plan #Diagram
-
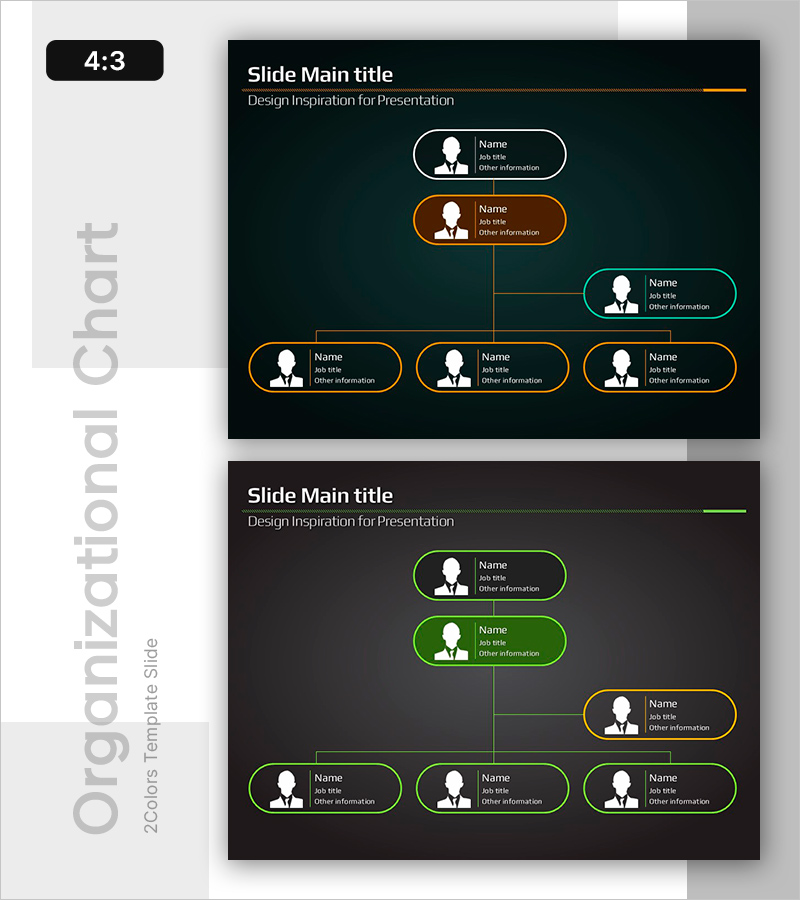
Roles and Responsibilities Map – Clear Organizational Structure
#Company Introduction #Diagram #Organizational Chart
-
Business Transaction Steps Procedure Visualization Diagram
#Business Promotion Strategy #Business Management #Diagram
