Market and Competitor Analysis
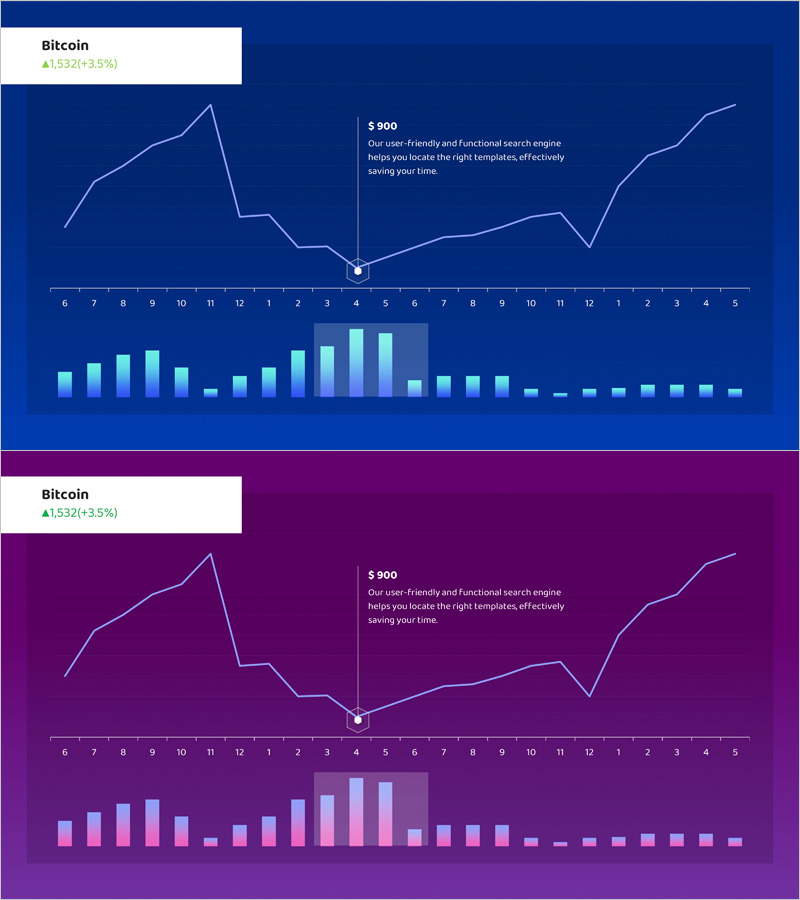
Stock Market Trend Graph
RJ0400064_12
- Last Update 12/21/2025
- File Size 0.2MB
- # of Slides 2
- File Format PPTX
- Slide Ratio 16:9
- Color
Keywords
About the Product
This slide features a graphical template to visualize stock market trends. Built on a structure of horizontal and vertical bars, it is suitable for market analysis materials for investors and executives. The harmonious blend of blue and purple offers a sense of stability and trust, emphasizing important performance data in visualizations. It can be effectively utilized in various business settings such as financial analysis, investment strategy presentations, or management reports.
Related Products
-
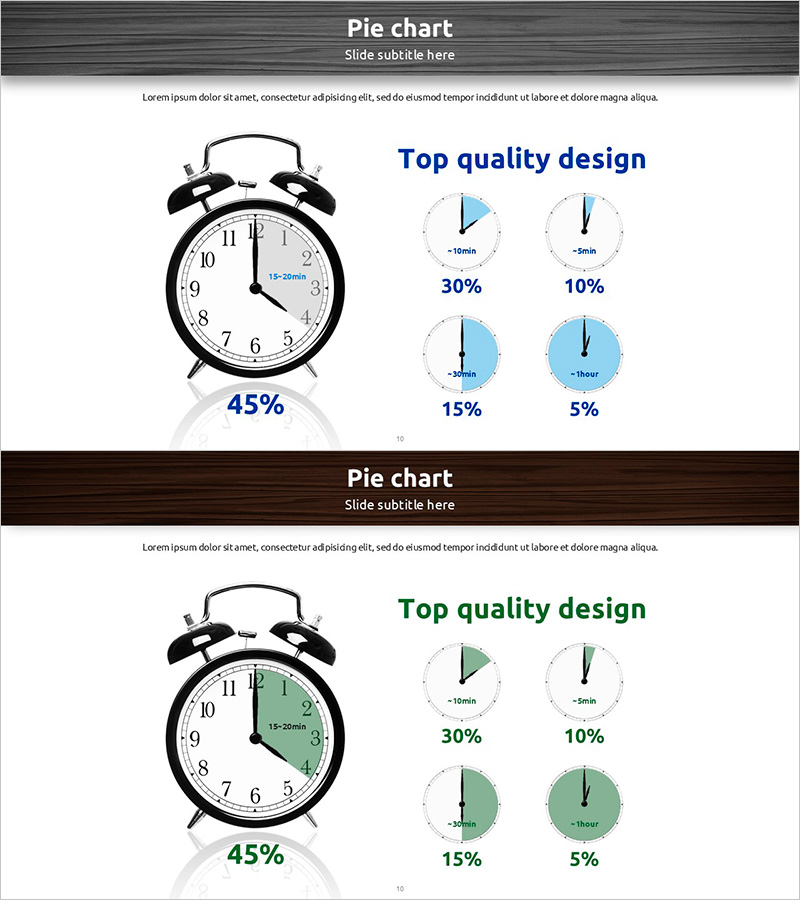
Hourly Pie Chart Slide – Progress and Planning
#Business Management #Graph #Schedule Plan
-
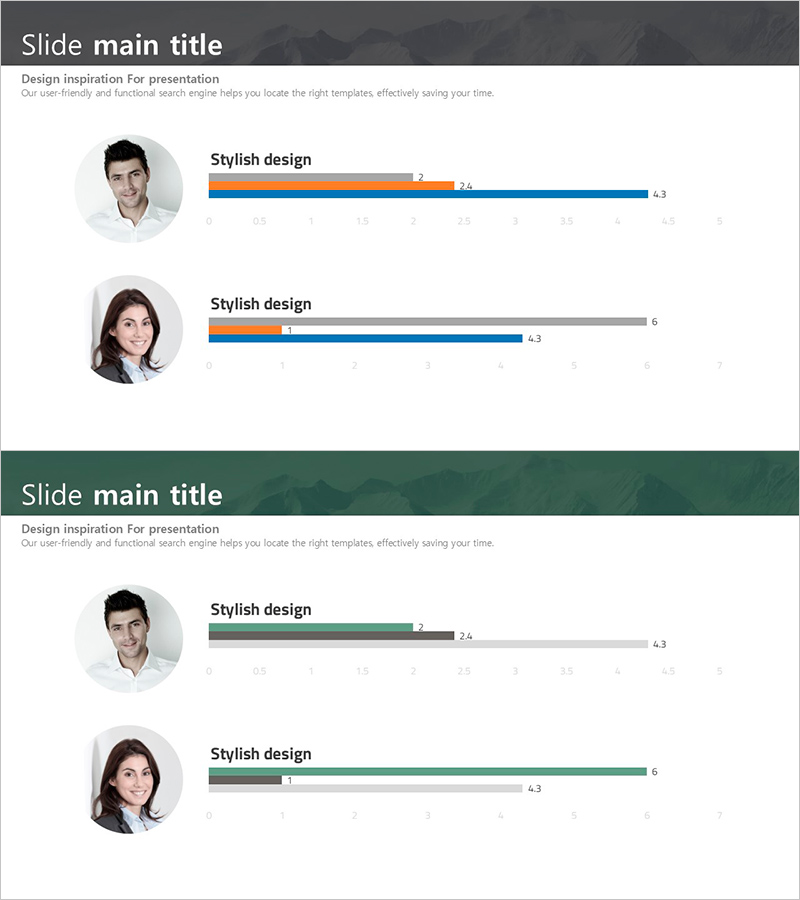
Three-Color Horizontal Bar Graph for Visualizing Sales Status – Business Insights
#Graph
-
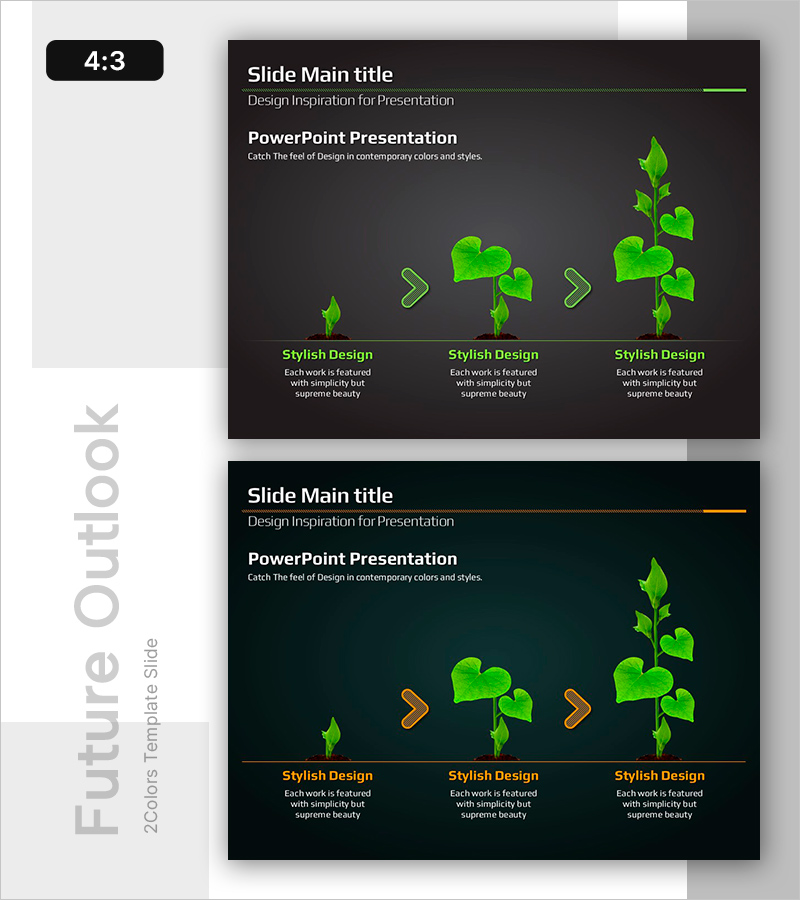
Structure and Characteristics of Plant Growth Stages – Technical Insight
#Technology Sector #Market and Competitor Analysis #Diagram
-
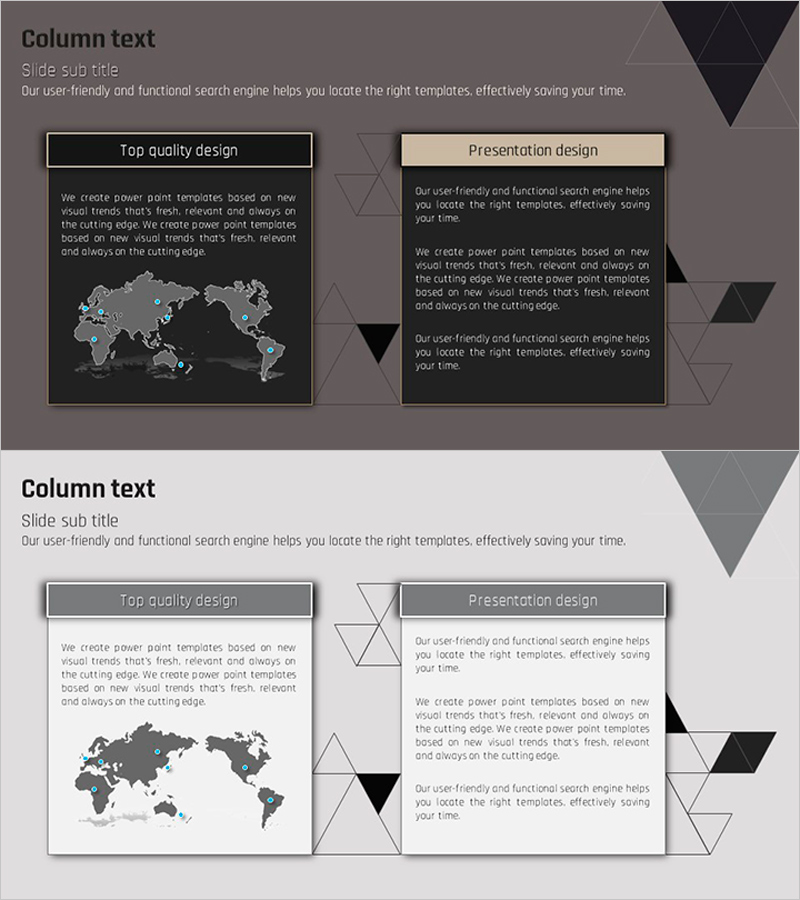
Maps and Columns Template – Global Network and Business Insights
#Company Introduction #Market and Competitor Analysis #Diagram
